
All Formulas 1RM Calculator
Compare all 7 one-rep max prediction formulas side by side — with formula metadata, reliability ratings, and an honest spread estimate.
| # | Formula | Est. 1RM | vs Avg | Reliability |
|---|
About the 7 FormulasAuthor · year · best use case
Which formula should I use?Guidance by lift and rep range
For 1–5 reps: Brzycki is generally most accurate. For bench press specifically, Mayhew and Brzycki are both well-validated.
For 6–10 reps: Epley or Wathan. Both are well-balanced across lifts.
For 11–20 reps: Wathan or Mayhew. Other formulas lose accuracy above 10 reps.
The Average (default) is a safe choice when unsure — it smooths out individual formula biases and gives a reasonable middle estimate.
No formula is perfectly accurate. A ±5–10% error is normal. The best 1RM estimate is a heavy single performed with good form.
No formula is perfectly accurate — individual variation, lift type, and training experience all affect real-world results. A true 1RM attempt under controlled conditions is always more accurate than any estimate.
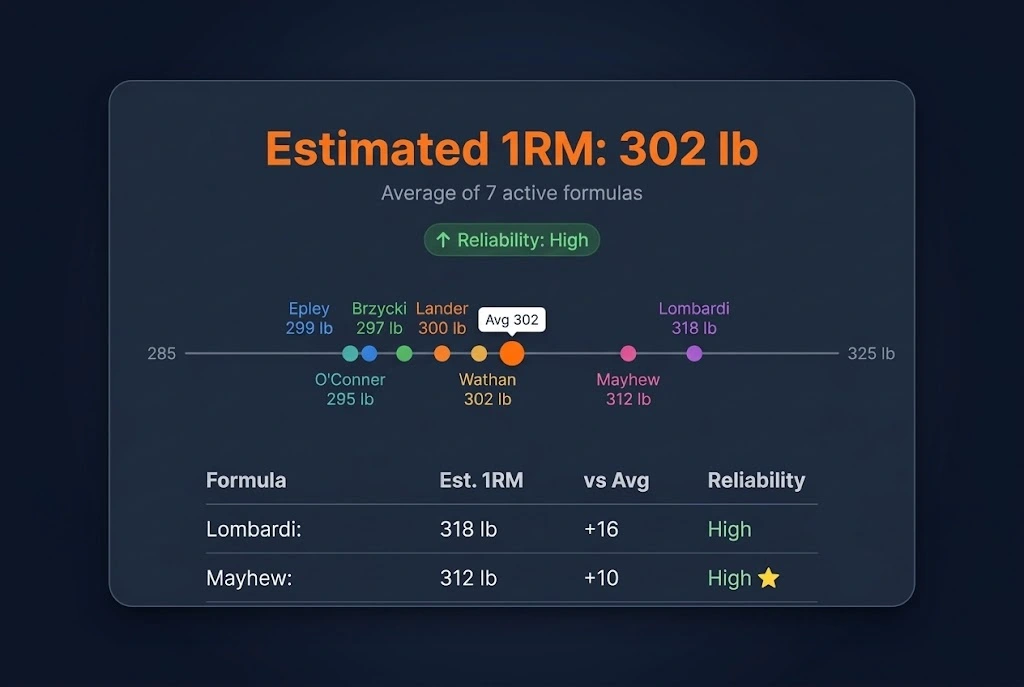
Most 1RM calculators show one formula’s estimate and call it your maximum. This all formulas 1rm calculator shows all seven simultaneously, visualizes the spread across a dot-plot, rates the reliability of each formula at your entered rep count, and lets you toggle formulas in and out of the average in real time. Where the one rep max calculator gives you a recommended output, this calculator is built for comparison: the spread itself is part of the answer.
What the All Formulas 1RM Calculator Does
| Feature | What it does |
| 🧮 Average 1RM Hero | Large primary display: the average across all active formulas, rounded to your selected increment |
| 📊 Dot-Plot Spread | The horizontal axis shows every formula as a dot: the tighter the cluster, the more trustworthy the estimate. |
| 🏷️ Overall Reliability Badge | High / Moderate / Low / Poor based on rep count across all active formulas |
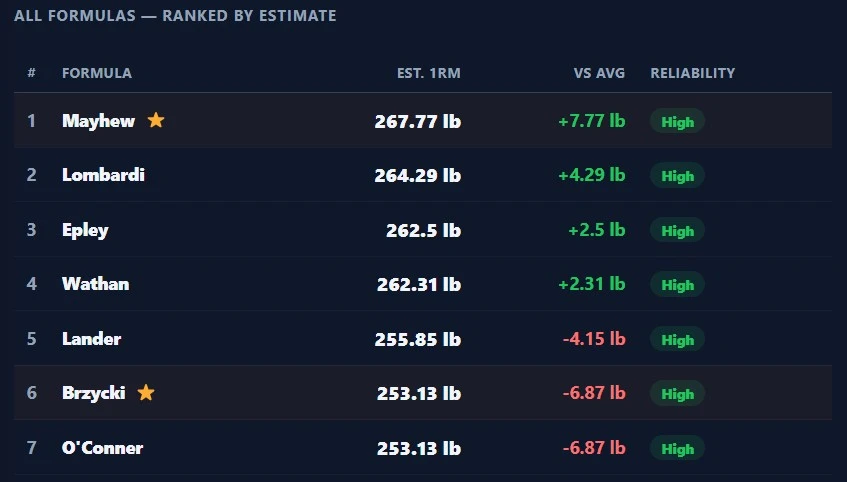
| 📋 Ranked Table | All 7 formulas ranked by estimate with vs-avg deviation and per-formula reliability columns |
| ⭐ Exercise Recommendations | Star badges on formulas are best validated for your selected exercise. |
| 💊 Formula Toggle Pills | Activate or deactivate any formula: average and dot-plot update live. |
| 💡 Recommendation Pill | Shows which formulas are best validated for your exercise and rep count after calculating |
| 📖 Per-Formula Reliability | Each formula rated at your entered rep count: High / Moderate / Low / Outside |
| 🎯 Exercise Selector | Back Squat, Bench Press, Deadlift, Overhead Press, and General: controls which formulas are starred |
| ⚡ Rep Quick-Select | One-click buttons for 1, 3, 5, 6, 8, 10, 12, 15, 20 reps |
| ⚙️ Rounding Options | 5 lb / 2.5 lb / 1 lb / Exact (lb) or 2.5 kg / 1.25 kg / 1 kg / Exact (kg) |
| ⚖️ Units | lb or kg toggle |
| 📚 About the Formulas Accordion | Author, year, best use case, and notes for each of the 7 formulas |
| ❓ Which Formula Accordion? | Guidance on formula selection by rep range and exercise |
| ↗️ Cross-Link | Direct link to the % of 1RM Calculator for planning training weights after estimating |
| ⬇️ PDF Export | Full results: ranked table, spread statistics, reliability, recommendations: all client-side |
The dot-plot spread and formula toggle pills are the standout differentiators: the spread visualizes reliability in a way no ranked list can, and the live toggle lets you explore exercise-specific consensus in real time.
Why Compare All Seven Formulas at Once?
The Problem with Single-Formula Tools
Most 1RM calculators commit to one formula, usually Epley, and present its output as the estimate. The problem is that no single formula is universally most accurate across all lifts, rep counts, and populations. Epley works well for squats at 3-8 reps. Mayhew was calibrated specifically on bench press subjects. Brzycki is most accurate at 1–5 reps but degrades at high rep counts. A tool that commits to one formula is implicitly claiming that formula is right for your specific situation, which may not be true.
The Case for the Consensus Average
The average of all active formulas is the primary output because no single formula consistently dominates: averaging reduces the influence of any one formula’s systematic bias. When seven independently derived models, each calibrated on different datasets and populations, agree on a value, their consensus is more trustworthy than any single prediction in isolation. The validation research testing all 7 formulas confirms that no single formula reliably outperforms the others across all conditions, making the consensus average the most defensible default.
When Formulas Agree and When They Don’t
Formula agreement is tightest at low rep counts (1–5 reps) and diverges progressively above 8 reps. At 3 reps, all seven typically agree within 2–3% of each other, and the average is highly reliable. At 12+ reps, individual variation in strength endurance (fast-twitch vs. slow-twitch dominance) and training state and fatigue level mean the same rep count at the same weight can represent very different 1RMs for different people. The dot plot makes this divergence instantly visible: the spread is information to act on, not noise to ignore.
How to Use the All Formulas 1RM Calculator?
Step 1: Enter Weight and Select Reps
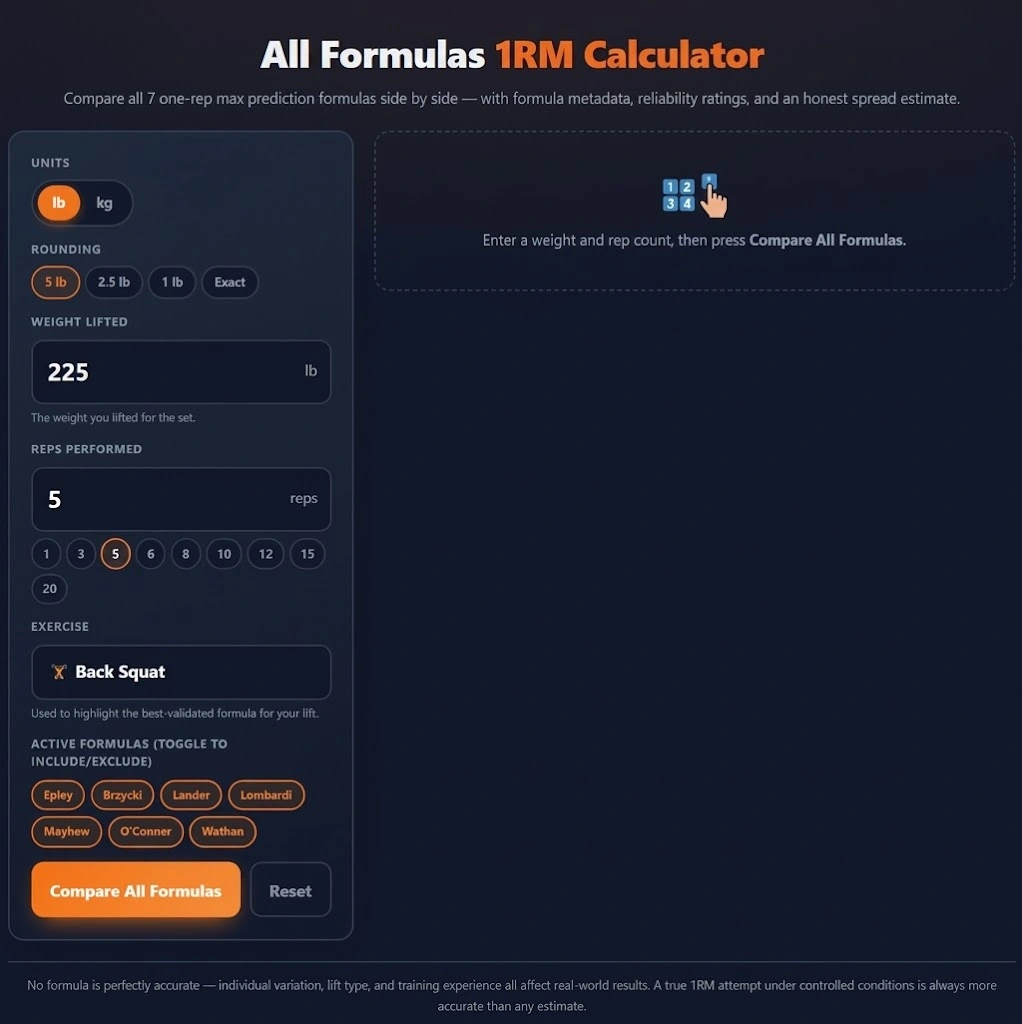
Type the weight you lifted in the Weight Lifted field. Select your rep count using the quick-select buttons (1, 3, 5, 6, 8, 10, 12, 15, 20) or type directly into the reps field. Choose lb or kg. For the most accurate estimates, use a rep count where you reached genuine maximal effort; a set stopped 3 reps early produces an underestimate for all formulas. Press Enter or click Compare All Formulas.
Step 2: Select Your Exercise
Choose from Back Squat, Bench Press, Deadlift, Overhead Press, or General. This controls which formulas receive ⭐ stars in the table: the formulas best validated for that lift. For bench press, Brzycki and Mayhew are starred. For squat and deadlift, Epley and Wathan. For overhead press, Epley and O’Conner. The exercise selection also drives the recommendation pill that appears after calculation, pointing you toward the most appropriate formulas for your context.
Step 3: Read the Average, Reliability Badge, and Dot Plot
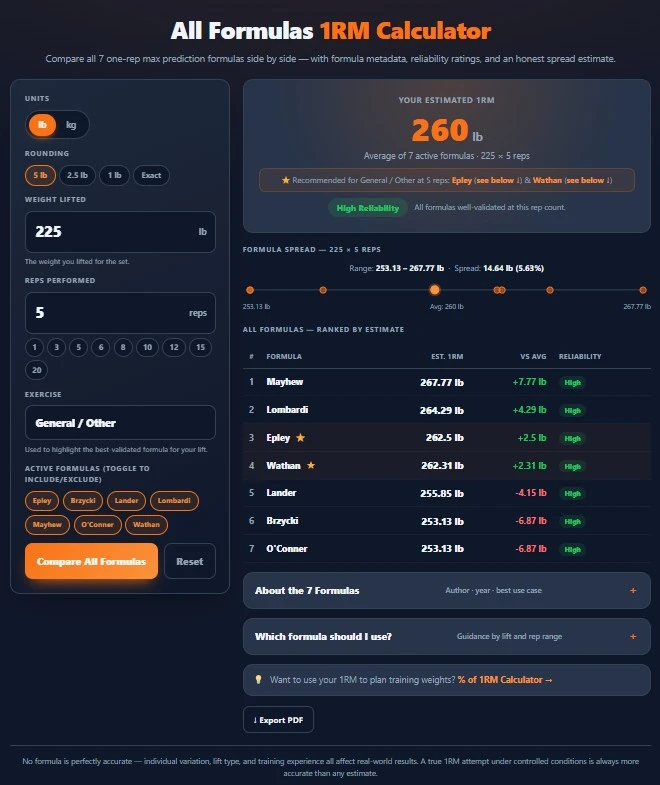
After pressing Compare All Formulas, the results panel shows four levels of information simultaneously: the large orange average 1RM; the Overall Reliability badge (High/Moderate/Low/Poor) based on your rep count; the dot-plot spread showing where each formula sits; and the ranked table with per-formula details. Start with the reliability badge: if it’s low or poor, the average number carries more uncertainty than it appears to.
Step 4: Toggle Formulas to Explore the Consensus
After the initial calculation, the formula toggle pills let you activate and deactivate individual formulas. When you toggle a formula, the average, dot plot, and ranked table update instantly: no re-entry required. Three common reasons to toggle:
- Bench press specialist view: keep only Brzycki and Mayhew active to see the tightest, most validated bench press estimate
- Conservative floor view: keep only O’Conner active to see the lowest plausible estimate
- High-rep focus view: keep only Mayhew and Wathan are active for sets of 10+ reps, since these two formulas have the widest validated ranges
The Dot-Plot Spread: The Signature Feature
How to Read the Dot Plot?
The dot plot has a horizontal axis representing a weight range. Each active formula is shown as a colored dot at the position corresponding to its estimate. The orange dot, slightly larger, marks the average. Inactive formulas appear as faded dots so you can still see where they would fall without contributing to the average. The visual span of the dots: how far apart the leftmost and rightmost dots sit is the spread. The tighter the cluster, the more the formulas agree.
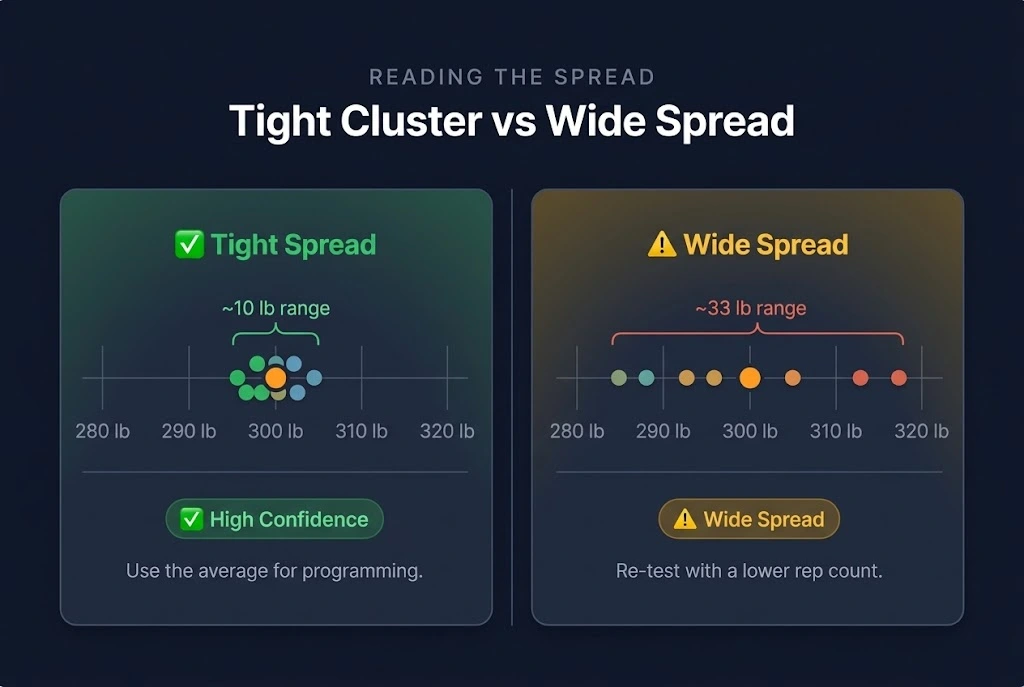
Tight Spread vs Wide Spread: What Each Means
| Spread | Threshold | Meaning | Action |
| Narrow | below 5% or below 5 lb | Formulas broadly agree: consensus is reliable. | Use the average confidently for programming. |
| Medium | 5–15% or 5–15 lb | Normal variation: average is reasonable. | Use the average; note individual formula recommendations. |
| Wide | above 15% or above 15 lb | Significant formula divergence | Treat the average as a rough estimate; retest with a lower rep count. |
A wide spread is almost always caused by a high rep count (12+). The solution is to re-test using a lower-rep set: 3–5 reps at challenging but controlled intensity. Low rep counts collapse the spread because all seven formulas converge in that range.
Using Spread to Calibrate Confidence
The spread provides something no single-formula calculator can: a self-reporting uncertainty signal. When a lifter enters 100 kg × 12 reps and sees a 35 lb spread across the formulas, the tool is communicating that the result is uncertain. When the same lifter enters 100 kg × 3 reps and sees a 5 lb spread, the estimate is trustworthy. The spread is data, not noise. For the full accuracy picture and how formula uncertainty relates to testing error, see How Accurate Are 1RM Calculators?
The Seven Formulas: Complete Reference
| Formula | Author | Year | Type | Best For | Valid Range |
| Epley | Boyd Epley | 1985 | Linear additive (r/30) | General; squat; deadlift | 1–12 reps |
| Brzycki | Matt Brzycki | 1993 | Linear denominator | Low reps (1–5); bench press | 1–10 reps |
| Lander | J. Lander | 1985 | Linear denominator | Moderate rep ranges (6–10) | 1–12 reps |
| Lombardi | Victor Lombardi | 1989 | Power function (r^0.10) | Power athletes; 1–7 reps | 1–10 reps |
| Mayhew | Mayhew et al. | 1992 | Exponential decay | Bench press; 10–20 reps | 1–20 reps |
| O’Conner | O’Conner et al. | 1989 | Linear additive (r/40) | Conservative floor estimate | 1–15 reps |
| Wathan | Dave Wathan | 1994 | Exponential decay | Balanced across all rep ranges | 1–20 reps |
For deep-dives on individual formulas, each has its own guide linked in the H3 sections below.
Epley (1985): The Universal Standard
Formula: w × (1 + r/30). The most widely cited 1RM formula in the academic and coaching literature, present in almost every strength and conditioning textbook. Adds 3.33% per rep. Accurate for 3–10 reps across most compound lifts. Slightly overestimates at higher rep counts. The default recommendation for squat and deadlift, and a reliable general-purpose choice across the full rep range. See the Epley Formula guide.
Brzycki (1993): Precision at Low Reps
Formula: w × 36 / (37 − r). Most accurate below 5 reps, outperforming most other formulas in this range. Uses a linear denominator that produces results close to Epley at low rep counts. Breaks down mathematically above 36 reps. Best used for 1–5 rep sets on bench press specifically, where it is the most validated formula available.
Lander (1985): The Conservative Moderate-Rep Formula
Formula: (100 × w) / (101.3 − 2.671 × r). A linear-denominator formula published the same year as Epley. More conservative than Epley at low rep counts, crossing above Epley at approximately 9.4 reps. Best for moderate rep ranges (6–10). The denominator approaches zero at approximately 37.9 reps: a mathematical limit. One of the most accurate formulas for the 6–9 rep range.
Lombardi (1989): Power Curve for Athletes
Formula: w × r^0.10. A power function that grows more slowly than additive formulas at high rep counts. Tends to produce higher estimates than Epley at 1–5 reps, crossing below at approximately 5.5 reps. Well-suited for power athletes and explosive sports contexts. The most conservative formula at moderate-to-high rep counts. See the Lombardi Formula guide.
Mayhew (1992): The Bench Press Specialist
Formula: (100 × w) / (52.2 + 41.9 × e^(−0.055 × r)). An exponential decay formula calibrated specifically on bench press subjects. Produces higher estimates than Epley at 3–7 reps, converging near 8 reps and becoming more conservative above 8. Among the best available formulas for 10–20 rep bench press sets. Not validated for non-bench press lifts: use with caution on squats or deadlifts. See the Mayhew Formula guide.
O’Conner (1989): The Conservative Floor
Formula: w × (1 + 0.025 × r). The simplest formula adds exactly 2.5% per rep, 75% of Epley’s rate. Consistently produces the lowest estimate of all seven formulas at moderate rep counts (5–11 reps). Useful as a conservative floor reference. The most stable formula at high rep counts, since it uses simple arithmetic with no denominator singularity. See the O’Conner Formula guide.
Wathan (1994): The Balanced Default
Formula: (100 × w) / (48.8 + 53.8 × e^(−0.075 × r)). An exponential decay formula similar in structure to Mayhew but with a slightly different curve. Among the most consistently accurate formulas from 1 to 20 reps. Produces very similar results to Epley in the 1–8 rep range but behaves more conservatively at high rep counts. The calculator recommends Wathan alongside Epley as the strongest default for general and lower-body lifts.
The Reliability System: Reading Confidence Signals
Overall Reliability by Rep Count
| Rep Count | Overall Reliability | What it means |
| 1–5 reps | ⬆️ High | All formulas are well-validated; a tight spread is expected; use averages confidently. |
| 6–10 reps | ➡️ Moderate | Generally reliable; some formula divergence; average is reasonable |
| 11–15 reps | ⬇️ Low | Increasing divergence; individual variation factors in; treat estimate with caution |
| 16+ reps | ❌ Poor | High formula variability; endurance factors dominate; rough estimate only |
Per-Formula Reliability Ranges
| Formula | High | Moderate | Low | Outside (not validated) |
| Epley | 1–5 | 6–9 | 10–12 | 13+ |
| Brzycki | 1–3 | 4–7 | 8–10 | 11+ |
| Lander | 1–5 | 6–9 | 10–12 | 13+ |
| Lombardi | 1–3 | 4–7 | 8–10 | 11+ |
| Mayhew | 1–8 | 9–14 | 15–20 | 21+ |
| O’Conner | 1–6 | 7–11 | 12–15 | 16+ |
| Wathan | 1–8 | 9–14 | 15–20 | 21+ |
Ranges are approximate and reflect the published validity limits of each formula’s original research. “Outside” formulas are still displayed for reference.
What “Outside” Means: Should You Use the Estimate?
When a formula’s per-formula reliability shows “Outside,” the calculator still displays the estimate but flags it as beyond the formula’s published validity range. These formulas were not tested at that rep count, and their estimates carry no meaningful validity guarantee. The toggle pills let you deactivate outside-range formulas to remove their contribution from the average. For rep counts above 15, filtering to Mayhew and Wathan: the formulas with the widest valid ranges produce the most defensible estimate. Reynolds et al. (2006) confirmed this: 5-rep sets consistently produce the highest prediction accuracy (R² = 0.993 for bench press), which anchors the reliability framework this system uses.
Formula Toggle Pills: Customize Your Average
How Toggling Changes the Average and the Spread
When you deactivate a formula pill, it is removed from the average calculation, and its dot becomes faded on the dot plot. The average and spread update in real time: no re-entry needed. This lets you experiment with different formula combinations without retyping data. At minimum one formula must be active: attempting to deactivate the last active formula triggers a shake animation and cancels the deactivation.
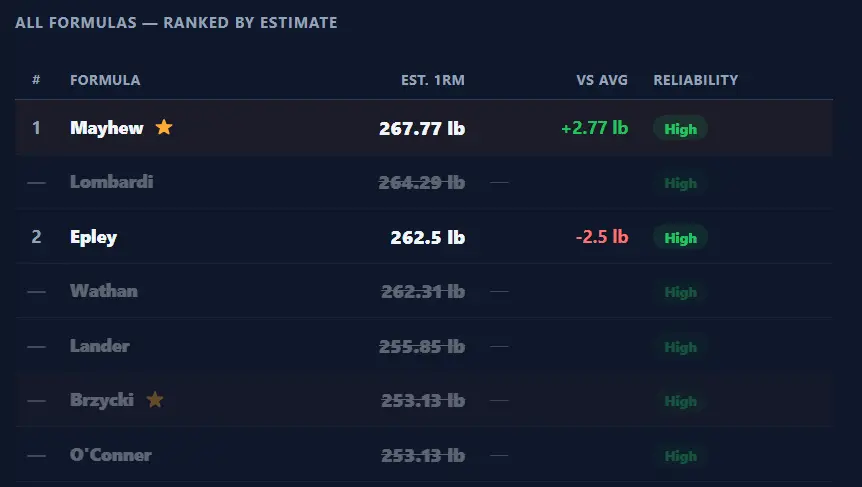
Exercise-Specific Combinations Worth Trying
Three toggle configurations, each purpose-built for a specific scenario:
- Bench press specialist view: Keep only Brzycki (⭐) and Mayhew (⭐) active. These are the two formulas most validated specifically for bench press. Their average at 3–8 reps is the tightest, most defensible bench press estimate.
- Conservative floor view: Keep only O’Conner active. This shows the lowest plausible estimate: any 1RM estimate above this number has a floor to anchor it.
- High-rep focus view: Keep only Mayhew and Wathan active for sets of 10+ reps. These formulas have the widest validated ranges and the best accuracy at moderate-to-high rep counts.
Exercise-Specific Formula Recommendations
The Formula Star System
| Exercise | Recommended Formulas (⭐) | Reason |
| Bench Press | Brzycki, Mayhew | Brzycki: highly accurate below 5 reps; Mayhew: calibrated on bench press subjects |
| Back Squat | Epley, Wathan | Epley: best-validated for squat in LeSuer et al.; Wathan: wide range, consistent |
| Deadlift | Epley, Wathan | Same as squat: no formula calibrated specifically for deadlift |
| Overhead Press | Epley, O’Conner | Epley as general default; O’Conner as conservative floor for OHP |
| General / Other | Epley, Wathan | Best general-purpose formulas across a wide range of lifts and rep counts |
Why Different Lifts Use Different Formulas
The reason formula recommendations differ by lift is that some formulas were developed using data from specific exercises. Mayhew was calibrated on bench press subjects: applying it to squat or deadlift data assumes the rep-to-1RM relationship is identical across lifts, which it isn’t. The lift-specific recommendations in this calculator reflect the research base behind each formula. For lifts with no formula-specific calibration (overhead press, barbell row), the best general-purpose formulas are the most defensible choice.
Exporting and Using Your Results
Export to PDF
Click Export PDF for a formatted summary containing the input parameters (weight, reps, exercise, and active formulas); the full ranked results table with vs-average and reliability columns; the average, range, and spread statistics; the overall reliability level; and the formula recommendations for the selected exercise. All generated client-side: no server, no data upload. Useful for training log entries, comparing estimates across sessions, or sharing results with a coach.
Using Your Estimate to Plan Training Weights
Once you have your estimated 1RM, the natural next step is generating training loads. The cross-link in the results panel takes you directly to the % of 1RM Calculator in one click. Enter the average 1RM from this calculator to generate a full training weight table at any percentage your program specifies. The RPE Calculator is the complementary tool for adjusting those loads daily based on how hard sets actually feel.
Technical Notes and Accuracy Limits
Formula Validity Limits and Outside-Range Behavior
Each formula has a validMax rep count: the upper boundary of the rep range used in its original research. Above that limit, the reliability column flags the formula as “Outside.” Outside-range formulas are still computed and displayed for reference but carry no meaningful validity guarantee. The calculator never hides outside-range estimates: visibility is the right policy, with the Outside label as the warning. For decision-making, filter to formulas rated high or moderate at your rep count.
Accuracy, Individual Variation, and the ±5–10% Reality
No formula produces a precise prediction. Individual factors: muscle fiber composition, training history, fatigue state, and technique: mean real-world error is typically ±5–10% even at low rep counts. A directly tested 1RM under controlled conditions will always be more accurate than any formula estimate. The all-formulas approach reduces formula bias; it does not reduce individual variation. Use estimates as planning anchors, not as verified facts about your ceiling.