
RPE Calculator
RTS-based training weight planning from Rate of Perceived Exertion
Maximum you can lift for 1 clean rep
RPE / RIR Reference Guide What does each RPE value feel like?
RPE 10 = can’t do another rep. RIR = how many more reps you had left.
All calculations use the Reactive Training Systems (RTS) table by Mike Tuchscherer.
Fixed-percentage calculators apply the same load every session. The RPE Calculator adjusts to how you feel that day. Where the one rep max calculator gives you your 1RM from a training set, this rpe calculator maps that number to the weight you should actually load: the same weight that felt like RPE 8 on Monday may feel like RPE 9 on Thursday after poor sleep and a heavy week. All four modes below account for that.
What the RPE Calculator Does
| Feature | What it does |
| 🏋️ Find Weight | Enter 1RM, reps, and target RPE: get the exact training weight to load. |
| 📋 Plan Sets | Generate a full per-set weight plan with fatigue modelling across a block. |
| 📊 Estimate 1RM | Enter a recent set’s weight, reps, and RPE: estimate your true 1RM. |
| 📐 RTS Chart | Full 12×9 RTS percentage table, live-updating, with optional weights overlaid |
| ⚙️ Rounding | lb or kg-appropriate increments, or exact for unrounded values |
| 📍 Rep/RPE Quick Selects | Segmented buttons for all valid reps (1–12) and RPE values (6–10 in 0.5 steps) |
| 💪 Set Status Labels | Each RPE level is labelled: Working Weight, Challenging, Near Limit, Max Effort. |
| 📖 RIR Reference | Accordion mapping every RPE value to Reps in Reserve |
| ⚠️ High-RPE Warning | Plan Sets warns when any set reaches RPE 9.5–10. |
| ⚠️ Low-RPE Warning | Estimate 1RM warns when RPE is below 8 (less accurate at lower intensities). |
| ⬇️ PDF Export | In-browser PDF for every mode; no server, no upload |
| Clean print view of current results | |
| 🔗 Cross-Link | Link to the One Rep Max Calculator for formula-based 1RM estimation |
| 📱 Mobile-Friendly | Fully responsive layout on any screen size |
| ♿ Accessible | Keyboard navigable, ARIA-compatible, visible focus indicators |
Four modes drive everything: Find weight for a single-set load, plan sets for a full training block with fatigue modelling, Estimate 1RM for reverse-calculating your max from a training set, and the RTS Chart for browsing the complete reference table.
What Is RPE? The Foundation of this Calculator
Rate of Perceived Exertion in Strength Training
RPE (Rate of Perceived Exertion) in strength training is a scale from 1 to 10 measuring how hard a set felt relative to your maximum effort, with 10 meaning you could not have done one more rep and 6 meaning you had approximately 4 reps remaining. Unlike the Borg scale used in cardio (which runs 6 to 20 and is assessed during exercise), the strength training RPE scale focuses specifically on proximity to muscular failure and is measured after the set. What matters is how many reps remained, not how generally difficult the effort felt.
RPE vs. Reps in Reserve (RIR)
RIR (Reps in Reserve) is an alternative expression of the same concept. RPE 8 equals 2 RIR: you had 2 reps left in the tank. RPE 9 equals 1 RIR. RPE 10 equals 0 RIR, meaning you reached absolute failure or could not have attempted another rep. Some lifters find RIR more concrete than RPE: counting what’s left is a tangible action, whereas assigning a number to perceived effort is more abstract. This calculator shows both for every result. The RIR Reference accordion lists the complete mapping.
The RPE Scale: 6 to 10 Explained
The RPE scale for strength training runs from 6 (approximately 4 reps left) to 10 (absolute maximum). Values below 6 are not used in strength programming because at very low intensities the distance from failure is large enough that effort ratings lose practical precision. The 0.5 increments exist for the “uncertain” states between whole rep counts.
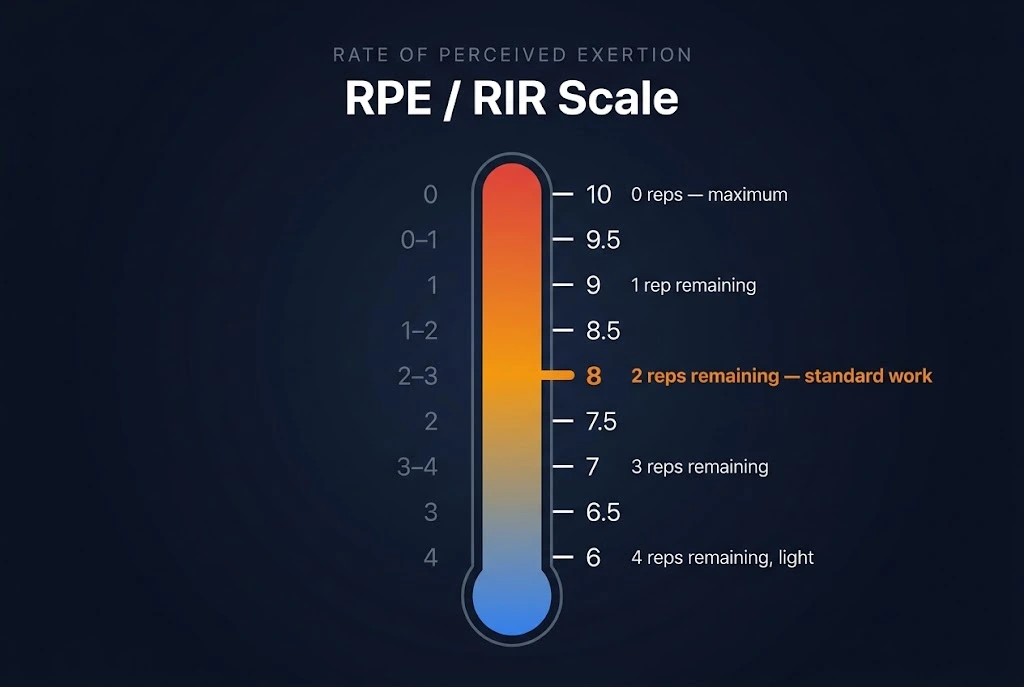
| RPE | RIR | Description |
| 10 | 0 | Maximum: couldn’t do another rep |
| 9.5 | 0–1 | Could barely attempt one more |
| 9 | 1 | Could do exactly 1 more rep |
| 8.5 | 1–2 | Uncertain about 1 or 2 more |
| 8 | 2 | Could do 2 more reps comfortably |
| 7.5 | 2–3 | Uncertain about 2 or 3 more |
| 7 | 3 | Could do 3 more reps |
| 6.5 | 3–4 | Uncertain about 3 or 4 more |
| 6 | 4 | Could do 4 more reps, fairly light |
Why RPE-Based Training Outperforms Fixed Percentages
A fixed percentage does not account for the fact that your effective 1RM varies daily. A lifter whose tested 1RM is 315 lb may be running a program at fixed percentages of that max, but after a week of poor sleep and missed meals, their actual ceiling might be 290 lb. “80% of 315 lb” on paper becomes a 90%+ effort in practice. RPE programming assigns effort directly: the weight adjusts to your readiness, not the other way around. The research validating RPE as a reliable measure of training intensity (Zourdos et al., 2016) confirmed RPE’s validity as a reliable intensity measure in competitive powerlifters.
The RTS Table: The Methodology Behind This Calculator
Who Is Mike Tuchscherer and What Is RTS?
The RTS percentage table was developed by Mike Tuchscherer, a competitive powerlifter, multiple World Championship team member, and one of the most influential coaches in the sport. He developed the Reactive Training Systems methodology as a systematic approach to autoregulated training, publishing the table so lifters can translate RPE ratings into precise percentage-based loads. The table has since become the primary reference for RPE-based powerlifting programming.
How the RTS Table Maps RPE to % of 1RM
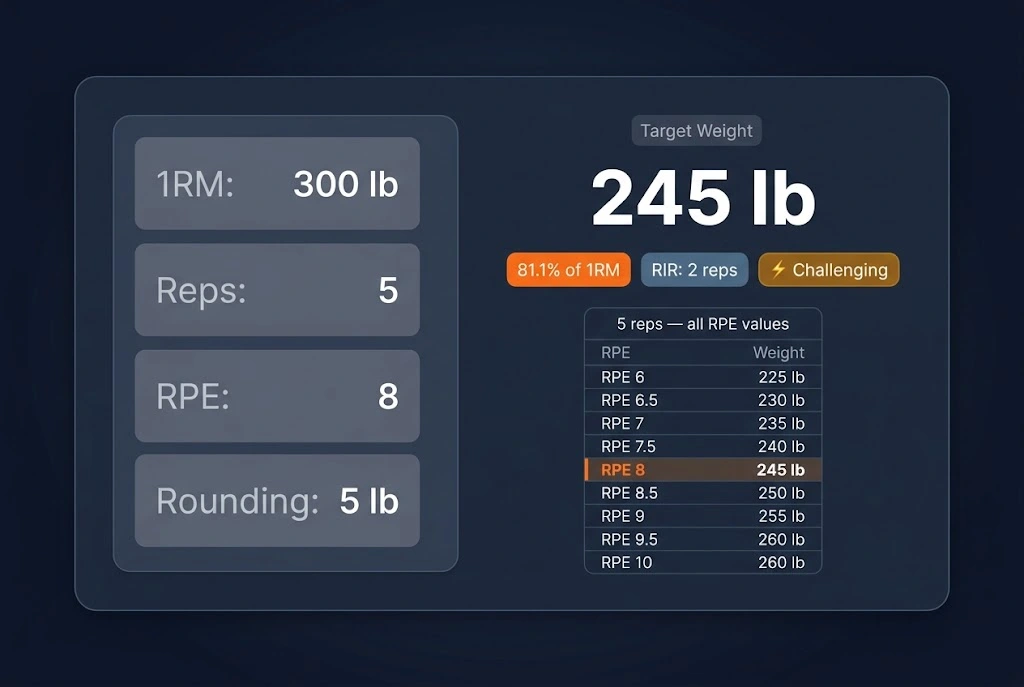
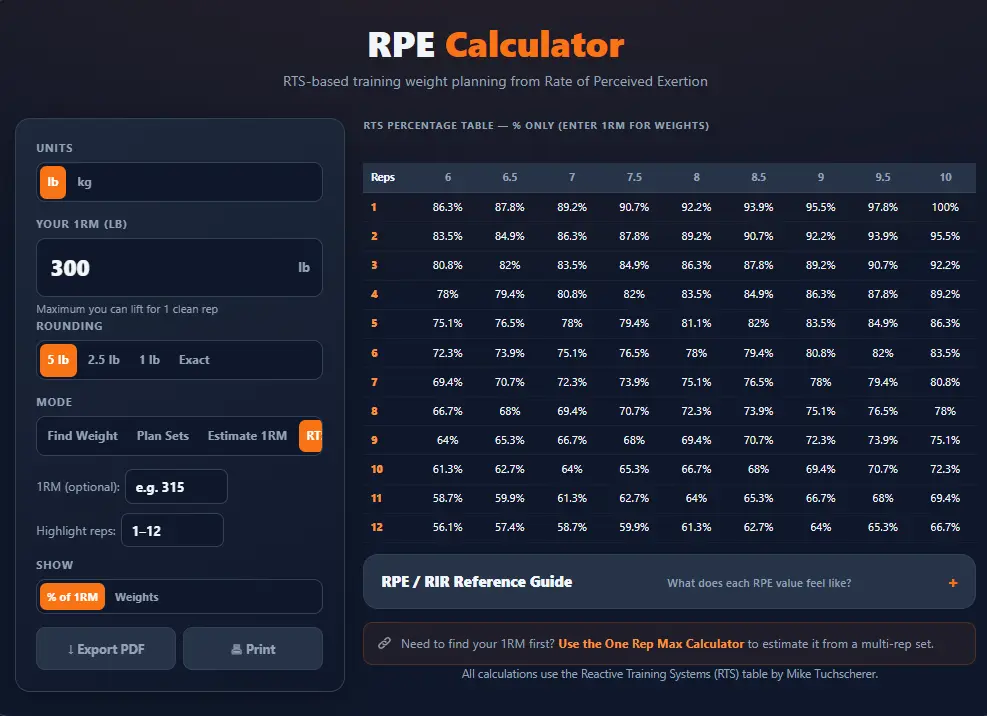
The RTS table is a 12×9 matrix: 12 rep levels (1 through 12) crossed with 9 RPE values (6, 6.5, 7, 7.5, 8, 8.5, 9, 9.5, 10). Each cell contains the percentage of 1RM that corresponds to performing that number of reps at that RPE. For example, 5 reps at RPE 8 = 81.1% of 1RM. If your 1RM is 300 lb, lifting 5 reps at exactly RPE 8 corresponds to 81.1% of 300 lb = 243.3 lb, which rounds to 245 lb with standard 5 lb rounding.
The Key RTS Percentages You’ll Use Most
The three most commonly programmed rep/RPE combinations in powerlifting are 5 reps at RPE 8, 3 reps at RPE 9, and 1 rep at RPE 10. The table below shows where these and other key rep counts sit across the intensity spectrum.
| Reps | RPE 6 | RPE 7 | RPE 8 | RPE 9 | RPE 10 |
| 1 | 86.3% | 89.2% | 92.2% | 95.5% | 100% |
| 3 | 80.8% | 83.5% | 86.3% | 89.2% | 92.2% |
| 5 | 75.1% | 78.0% | 81.1% | 83.5% | 86.3% |
| 8 | 66.7% | 69.4% | 72.3% | 75.1% | 78.0% |
| 10 | 61.3% | 64.0% | 66.7% | 69.4% | 72.3% |
| 12 | 56.1% | 58.7% | 61.3% | 64.0% | 66.7% |
A full 12×9 table with all 0.5-step RPE values is available in the RTS Chart mode above.
How to use the RPE Calculator?
Step 1: Select Units and Enter Your 1RM
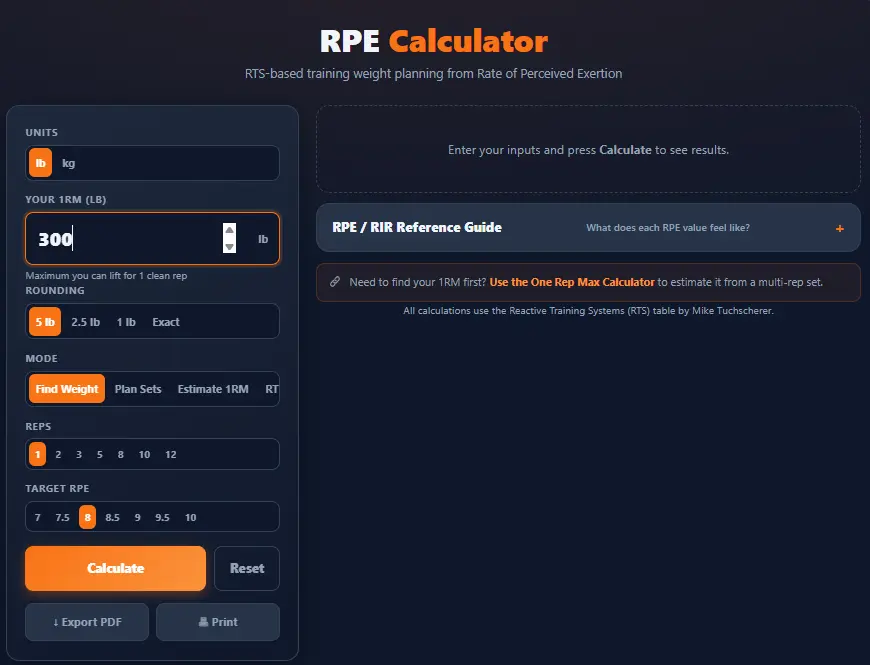
Choose lb or kg. Switching units updates all labels instantly; the 1RM field is not auto-converted. Enter your 1RM for Find Weight and Plan Sets. Without a tested 1RM, use the Estimate 1RM mode or the one rep max calculator to estimate one from a multi-rep set. Maximum accepted: 2,000 in any unit.
Step 2: Choose a Rounding Option
The same four options as the % of 1RM Calculator: Standard (5 lb / 2.5 kg) for most gym environments, Fine (2.5 lb / 1.25 kg) for fractional plates, Minimal (1 lb / 1 kg) for precision loading, and Exact for unrounded values in programming software. The rounding option applies across all four modes.
Step 3: Select Your Mode
Four modes, each solving a distinct problem:
- Find Weight: “I’m training at 5 reps, RPE 8 today. What weight do I load?”
- Plan Sets: “I’m doing 3 sets of 5. How do I account for fatigue accumulating across sets?”
- Estimate 1RM: “I just did 240 lb for 5 reps at RPE 8. What does that predict for my 1RM?”
- RTS Chart: “I want to browse the full RTS table and see all the percentages.”
Step 4: Set Reps and RPE Using Quick-Select Buttons
Both the Reps and RPE inputs have quick-select segmented button groups; no typing is needed for standard values. Reps buttons cover 1–12 (all valid integer rep counts). RPE buttons cover 6–10 in 0.5 increments (the full RTS table range). Clicking a button sets the field value instantly. You can also type directly into either field; the matching button highlights automatically if your typed value corresponds to one of the available options.
Find Weight Mode: Load the Bar for Any RPE
What the Results Show
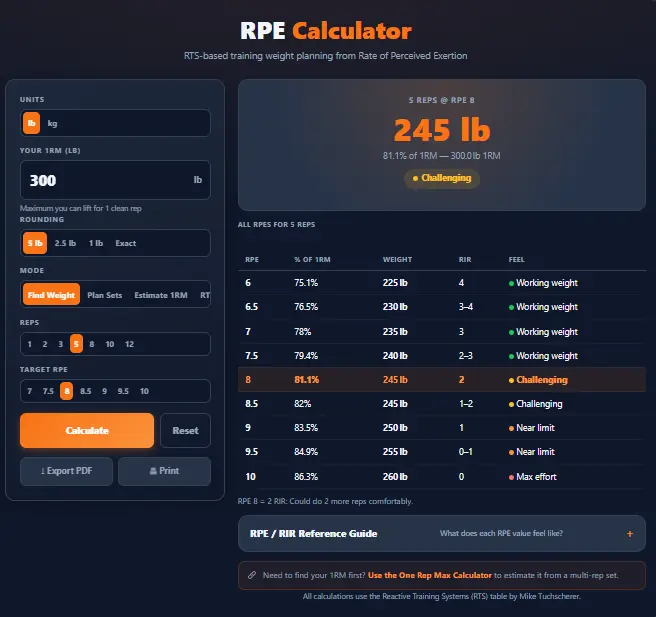
After calculating, the result card shows the target weight (rounded to your plate increment), the percentage of 1RM from the RTS table, RIR (reps you should have left at the end of the set), and the Intensity Status badge. Below the result, the Full Row Table shows all 9 RPE values for your selected rep count, with your target highlighted in orange.
Set Status Labels: Reading Your Intensity Level
The status label is a quick reference to prevent accidentally programming near-maximal effort into every session. Standard strength work should be primarily challenging (RPE 8–8.5); near limit and max effort are reserved for specific peaking sessions or testing days.
| Label | RPE Range | Meaning |
| ✅ Working Weight | RPE 7.5 and below | Comfortable training load; appropriate for volume work |
| ⚡ Challenging | RPE 8–8.5 | Standard strength work: hard but manageable |
| 🔴 Near Limit | RPE 9–9.5 | High-intensity work; requires full focus and a spotter |
| 💀 Max Effort | RPE 10 | True maximum; reserved for testing or competition |
The Full Row Table: All RPE Options for Your Rep Count
The row table below the primary result shows every RPE value (6 through 10 in 0.5 increments) for the rep count you selected. This is useful for comparing how different RPE targets produce different training weights on the same rep scheme, for deciding whether to adjust your target RPE if the calculated weight doesn’t land on a convenient plate combination, and for understanding the full intensity spectrum available for a single rep count at a glance.
Plan Sets Mode: Fatigue Modelling Across Your Block
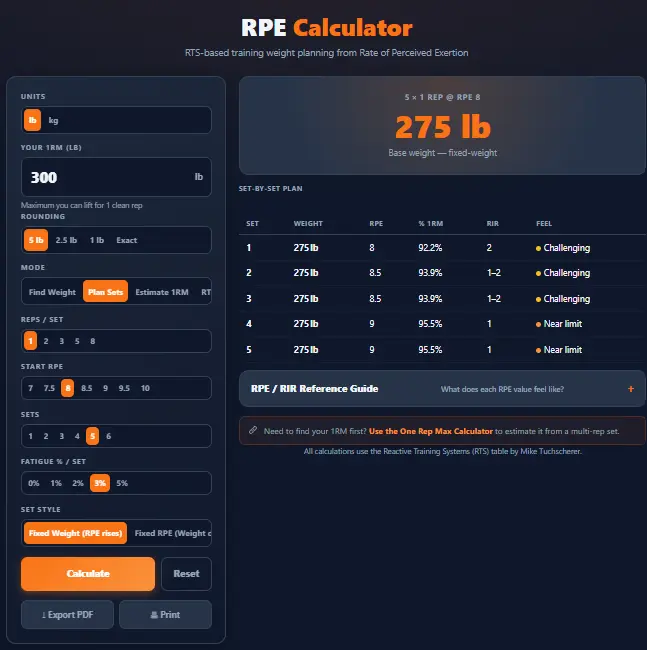
Fixed Weight Style: The RPE Rises as You Fatigue
In Fixed Weight style, the weight stays the same every set. As sets accumulate, the same weight feels harder, so the RPE rises. The fatigue % is divided by 10 to get the RPE rise per set (3% fatigue means +0.3 RPE, snapped to the nearest 0.5). Starting at RPE 8 with 3% fatigue across 3 sets produces Set 1 at RPE 8, Set 2 at RPE 8.5, Set 3 at RPE 9, all at 245 lb (using a 300 lb 1RM). The sets get harder as fatigue builds, even when the weight doesn’t change.
Fixed RPE Style: The Weight Drops as You Fatigue
In Fixed RPE style, the RPE stays constant across sets, but the weight drops to maintain that consistent effort level. The calculator adjusts the effective 1RM downward by the fatigue factor per set, then recalculates the weight for the target RPE at the reduced ceiling. Formula: adjusted 1RM = 1RM × (1 − fatigue%) raised to the set number. For 3% fatigue across 3 sets at RPE 8 for 5 reps: Set 1 is 245 lb, Set 2 is 240 lb, Set 3 is 235 lb, all at RPE 8. You reduce the load to preserve the intended effort level.
Setting the Fatigue Percentage
The fatigue % parameter (0–8% per set) controls how aggressively fatigue accumulates. Common settings and what they model:
- 0%: No fatigue (all sets identical). Use for warm-ups or when uncertain how much fatigue to expect.
- 1–2%: Light fatigue. Typical for lower-volume, higher-intensity work (3 sets of 3–5 reps).
- 2–3%: Moderate fatigue. Standard for most strength block programming (3–5 sets of 5 reps).
- 4–5%: Significant fatigue. Use for higher-volume hypertrophy blocks or when training with limited rest.
- 6–8%: Heavy fatigue. Models high-volume or high-density sessions with short rest periods.
The High-RPE Warning
When any set in the plan reaches RPE 9.5 or 10, a warning appears: ensure you are well-rested and have a spotter for near-maximal efforts. This typically occurs when starting RPE is already high (8.5+) and fatigue accumulates across multiple sets. If the warning appears, reduce the starting RPE, reduce the number of sets, or reduce the fatigue % to keep the majority of your training below the near-maximal zone.
Estimate 1RM Mode: Find Your Max from Any Training Set
How the Reverse RTS Calculation Works
The formula reverses the RTS table: if the table says 5 reps at RPE 8 = 81.1% of 1RM, then the 1RM = weight divided by 0.811. If you squatted 243 lb for 5 reps at RPE 8, your estimated 1RM = 243 ÷ 0.811 ≈ 300 lb. This is a different estimation method from the Epley Formula and Brzycki formulas in the main 1RM calculator. Instead of estimating from rep count alone, it uses your subjective effort rating to contextualize the estimate. On a day when the weight moved harder than usual, the RPE reflects that; a formula using only reps cannot.
When RPE-Based Estimation Is Most Accurate
RPE-based 1RM estimation is most reliable at RPE 8–10 with 1–5 reps. Below RPE 8, small variations in perceived exertion at lower intensities correspond to larger swings in the predicted 1RM. A low-RPE warning appears when RPE is below 8, alerting you that the result carries more uncertainty. The calculation still runs, but treat it as a rough starting point. For the full accuracy context, see How Accurate Are 1RM Calculators?
Most accurate inputs for this mode:
- RPE 8–10 (the closer to 10, the more precise the estimate)
- Low rep counts (1–5 reps)
- RPE assessed immediately after the set, not estimated hours later
- RPE calibrated over several months of consistent training with feedback
Compared to Formula-Based 1RM Estimation
The main one rep max calculator estimates 1RM from reps alone with no RPE input. If you did 5 reps at RPE 9, formula-only estimation doesn’t know you were working harder than usual; the RPE approach does. Compare both outputs: if they’re close, your RPE calibration is good; a large gap suggests the rating needs adjustment. The % of 1RM Calculator can cross-check either estimate against percentage-based training loads.
RTS Chart Mode: Browse the Full Reference Table
Browsing the Full 12×9 Table
The RTS Chart renders automatically when you switch to this mode; no Calculate button press is required. The full table covers 12 rep levels (1 through 12) crossed with 9 RPE values (6, 6.5, 7, 7.5, 8, 8.5, 9, 9.5, 10). This is the same underlying data that Find Weight and Plan Sets use, presented as a complete, browsable reference. Use it to observe how the same RPE at different rep counts produces very different percentages and how the same rep count at different RPEs spans a surprisingly wide intensity range.
Highlighting a Row and Switching Views
Enter a rep count in the Highlight Reps field to focus the table on that rep scheme: the row gets a left border and background tint, making it easy to scan all RPE values for a single rep count. Toggle between percentage view and weight view at any time. In weight view, cells show actual weights rounded to your selected increment (requires a 1RM to be entered). The view switch updates instantly; without a 1RM entered, only a percentage view is available.
RPE Training in Programming: Putting It into Practice
RPE as Daily Autoregulation
The most direct application of Find Weight mode: use it before every session to set loads based on how you feel that day. Instead of programming “315 lb × 5 × 3” and hoping it’s right, program “5 reps × 3 sets at RPE 8” and let performance determine the weight. On a strong day, 300 lb. might feel like RPE 8; on a fatigued day, 275 lb. might. The effort stays consistent; the absolute load adapts. For the full framework, see Strength Training Programming.
Combining RPE with Percentage Targets
Many intermediate programs use a hybrid approach: set the training load using percentages, then validate it with RPE. If 80% of your 1RM is supposed to feel like RPE 8 for 5 reps but actually feels like RPE 9.5, something is off; either your 1RM has decreased or accumulated fatigue is running higher than expected. The RPE gives immediate feedback that a pure percentage can’t. Use the % of 1RM Calculator to set the initial load, then use the RPE Calculator to validate and adjust.
When to Update Your 1RM for RPE Programming
Your 1RM input represents your current strength ceiling. If you’ve been training consistently and sets programmed at RPE 8 now feel like RPE 6–7, it’s time to retest or re-estimate your 1RM. Use Estimate 1RM mode with a recent top set to get an updated number, then re-enter it as the basis for Find Weight and Plan Sets. Re-test every 8–12 weeks or at the end of each training block.
Export, Print, and Take Your RPE Plan to the Gym
Export to PDF
Clicking Export PDF generates a PDF in your browser (saved as rpe-training.pdf); no server, no upload, no data leaves your device. Each mode generates a mode-specific PDF:
- Find Weight PDF: target weight, RPE, % of 1RM, RIR, and the full row table
- Plan Sets PDF: all sets with weight, RPE, and RIR for every set in the plan
- Estimate 1RM PDF: input set details and the estimated 1RM
- RTS Chart PDF: full 12×9 table in percentage or weight view (whichever is displayed)
The Plan Sets PDF is the most practically useful for the gym: it shows exactly what to load for each set without needing to reference the calculator during the session.
Clicking Print opens the browser’s print dialog with a stylesheet that hides the calculator UI and renders a clean, ink-friendly version of the current result. Works with “Save as PDF” in the browser as an alternative to the Export button. For the RTS Chart, the print view renders the full table in a format suitable for coaching boards or binder reference sheets.
Technical Notes and Limitations
Validation Rules
All computation runs client-side in JavaScript; no data is sent to any server. The engine is deterministic: identical inputs always produce identical outputs. For background on the 1RM input, see the One Rep Max Basics guide.
| Input | Rule |
| 1RM | Finite positive number; maximum 2,000 (any unit) |
| Reps | Integer 1–12 |
| RPE | One of: 6, 6.5, 7, 7.5, 8, 8.5, 9, 9.5, 10 |
| Sets (Plan Sets) | Integer 1–6 |
| Fatigue % (Plan Sets) | Number 0–8 |
| Weight (Estimate 1RM) | Finite positive number; maximum 2,000 |
All errors display inline beneath the Calculate button; no alerts, no page reload.
Limitations of RPE-Based Programming
- Individual variation is real. The RTS table is calibrated on trained powerlifters. Beginners may find their numbers differ by ±5–10%; RPE calibration is a skill that develops with training experience and coaching feedback.
- RPE accuracy requires experience. New lifters often underestimate how close they are to failure, rating a set RPE of 7 that was actually RPE 9. The more experience you have, the more reliable your ratings become.
- Low-rep estimates are more reliable than high-rep. Above 8 reps, individual variation compounds. Estimates from 1–5 rep sets are the most accurate.
- Fatigue % is a modelling assumption. The plan sets fatigue percentage that approximates actual accumulation; real fatigue varies by rest time, training age, and exercise selection.