
Rep Range to % 1RM Converter
Convert reps at weight to estimated 1RM percentage using 7 prediction formulas
Formula Breakdown
About the formulas
Brzycki — accurate below 10 reps; gives 0 at 37+ reps.
Lander — linear decay, stable across rep ranges.
Lombardi — power-law model, best for higher reps.
Mayhew — exponential asymptote, popular in research.
O’Conner — simple linear, conservative estimates.
Wathan — exponential, similar structure to Mayhew.
Every rep range you train in corresponds to a specific percentage of your 1RM: a number that defines the training zone, the physiological stimulus, and the weights that belong on the bar. This rep range 1rm calculator runs all seven major prediction formulas simultaneously to answer two questions at once: What percentage of your 1RM is a given rep count, and what weight does that mean for your specific maximum? If you don't have a tested 1RM yet, the one rep max calculator can estimate one from any working set first.
What the Rep Range to % 1RM Converter Does
| Feature | What it does |
| 🔄 Convert Reps: Enter 1RM | Input a 1RM and rep count: get average %, zone badge, and 7-formula bar chart. |
| 🔄 Convert Reps: Reps + Weight | Input weight + reps: back-calculate estimated 1RM, then show % and formula chart |
| 📋 RM Table | Full rep-max reference table from 1RM: 8, 12, 15, or 20 rows, with zones and formula columns |
| 🎯 Goal Planner | Four training goal cards (powerlifting, strength, hypertrophy, and endurance) with per-rep weights |
| 📊 Formula Bar Chart | Visual side-by-side comparison of all 7 formulas: bar widths show the true spread. |
| 🏷️ Training Zone Badge | Each result labelled with the zone (maximal strength through cardiovascular endurance). |
| 📖 Training Goal Description | Each zone is paired with a plain-English goal and rep-range rationale. |
| 7️⃣ Seven Formulas | Epley, Brzycki, Lander, Lombardi, Mayhew, O'Conner, and Wathan: average used as primary |
| ⚖️ lb / kg Units | Per-mode unit toggle: updates all labels and weights instantly |
| ~XX% Notation | Tilde prefix on all estimates except the 1-rep result (exact by definition) |
| ⌨️ Keyboard Support | Enter triggers calculation; all controls are keyboard-navigable. |
| 🔁 Reset | Clears all inputs and results to start fresh |
| 📱 Mobile-Friendly | Segmented rep controls scroll horizontally on narrow viewports. |
Three modes drive everything: Convert Reps for real-time session feedback, RM Table for a full training reference sheet, and Goal Planner for mapping a specific training target to weights. The formula bar chart is the visual differentiator that no lookup table provides.
The Three Modes: How to Choose
Pick the mode that matches your question before you start:
- Convert Reps: "I'm doing 8 reps today. What percentage of my 1RM is that?" or "I just did 120 kg for 5 reps. What does that tell me about my 1RM?" Use this for real-time session feedback and understanding where any set sits in the intensity spectrum.
- RM Table: "I want a full reference sheet showing every rep count from 1 to 12 with weights for my 1RM." Use this for pre-session planning or for printing a training reference to bring to the gym.
- Goal Planner: "I want to train for hypertrophy. What specific weights should I use for the relevant rep ranges?" Use this when switching training goals and needing a concrete weight prescription for each rep target.
Convert Reps Mode: Find Your % of 1RM for Any Rep Count
Input Mode 1: Enter Your Known 1RM
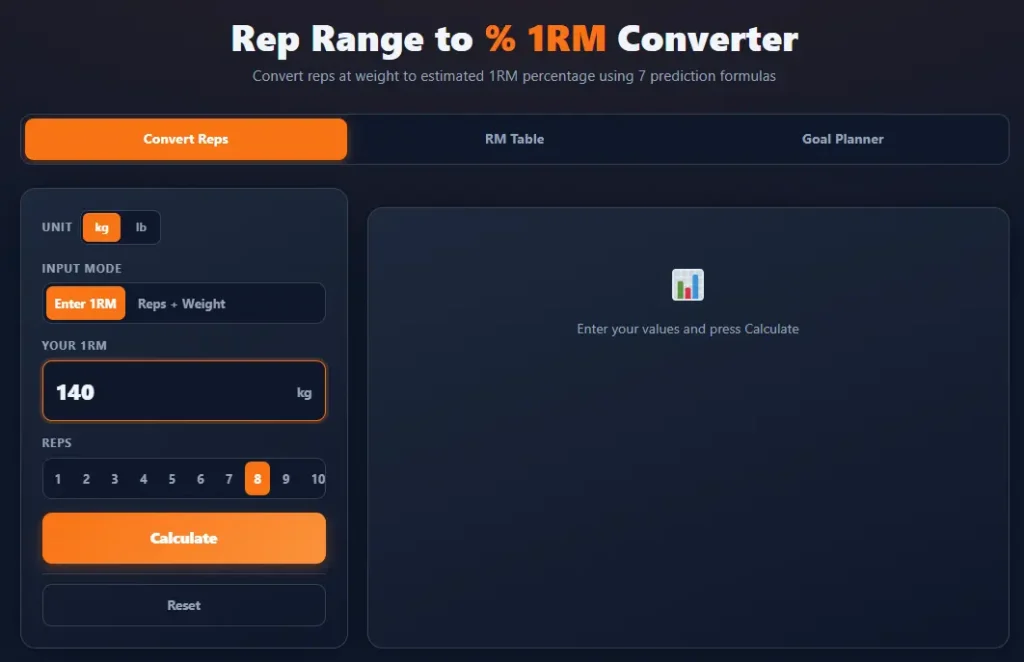
Select the "Enter 1RM" mode toggle. Type your 1RM: the tested or estimated maximum for the specific lift. Choose a rep count from the segmented control (1–20 in integer steps). Press Calculate or press Enter. The calculator runs all seven formulas against the rep count, averages the valid outputs, and displays the result. This mode answers, "Given my current ceiling, what intensity does this rep count represent today?"
Input Mode 2: Reps + Weight (Back-Calculate Your 1RM)
Select the "Reps + Weight" mode toggle. Enter the weight you actually lifted and the rep count you completed. The calculator back-calculates an estimated 1RM from that set using all seven formulas, then displays both the estimated 1RM and the corresponding percentage for your rep count, answering "What's my 1RM?" and "How hard did I work today?" in a single step. This is the most useful mode for lifters who train with consistent working weights but don't keep a tested 1RM on file.
Reading the Results: Average %, Zone Badge, and Description
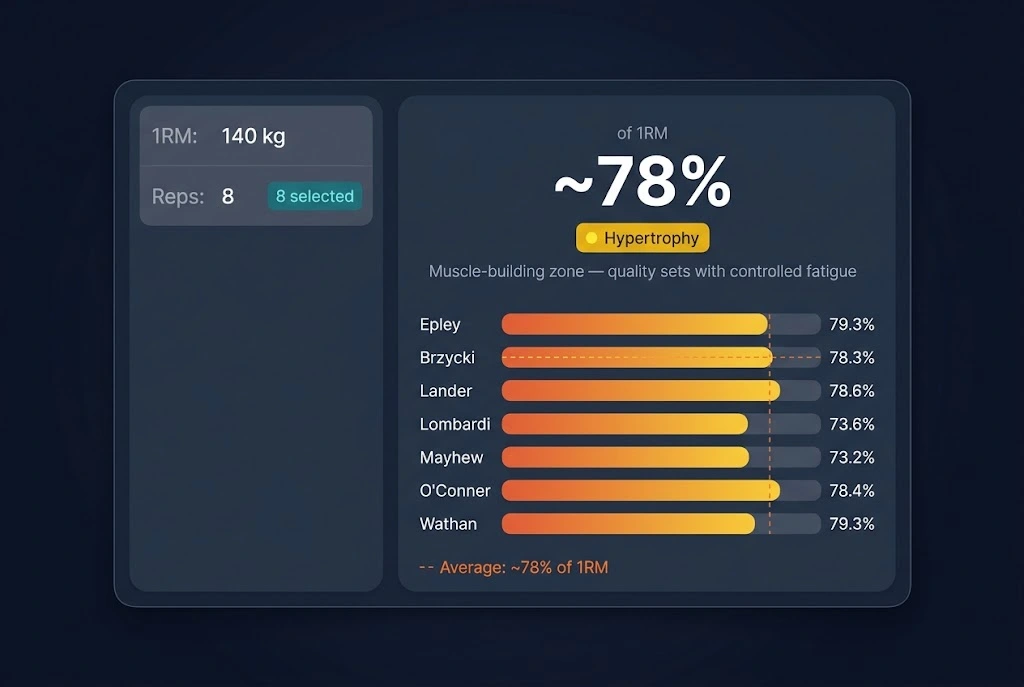
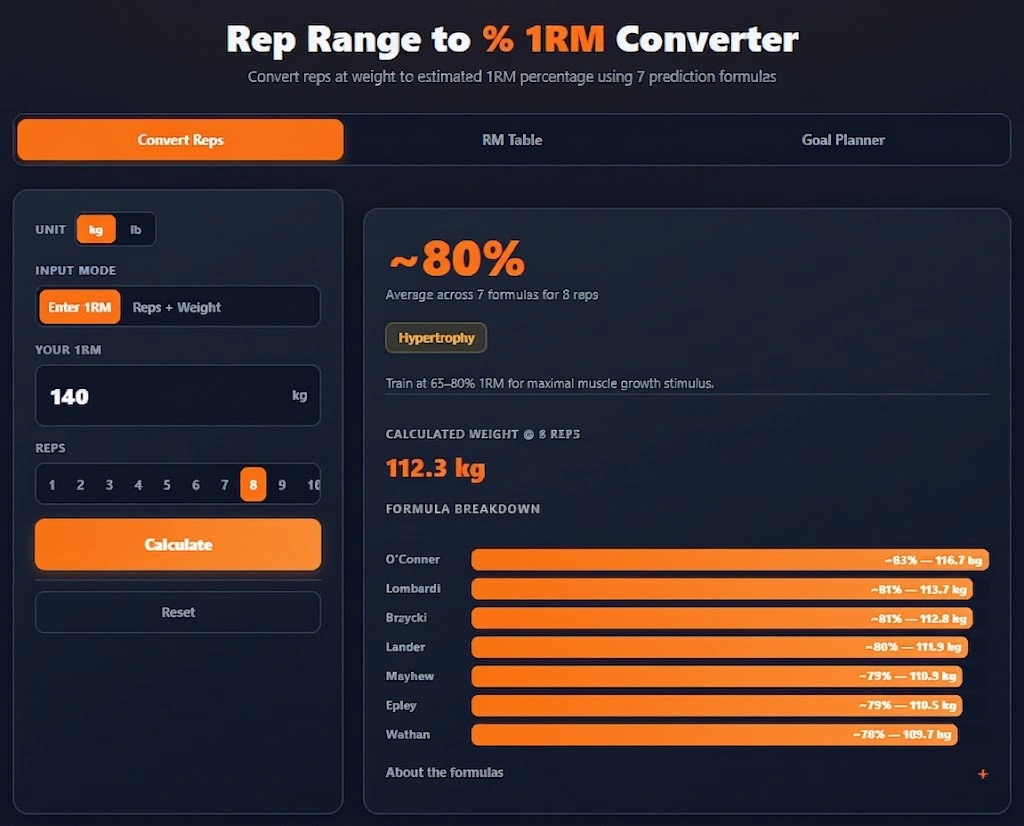
After calculation, the result panel shows three layers. First, the primary percentage display: the average across all 7 formulas, prefixed with a tilde (~) to signal it's an estimate rather than a measured value. Second, the zone badge: a color-coded label identifying the training zone the rep count falls in (for example, hypertrophy in yellow). Third, a training goal description: a plain-English explanation of the stimulus that zone produces. All three together give a complete picture of what that rep count means for training intent.
The Formula Bar Chart: Why Seven Formulas, and What the Spread Means
How Does the Bar Chart Work?
Seven horizontal bars appear below the primary result, one per formula. Each bar shows the formula name on the left, the estimated percentage at the right end, and a bar whose width reflects that formula's estimate relative to the highest output at that rep count. The bars are not scaled to an arbitrary 100% reference: they show the true relative spread between formulas. At 1 rep, all formulas agree exactly at 100%, and all bars are equal. At 8 reps, the bars diverge noticeably.
What the Spread Between Bars Tells You
A tight cluster, where all bars are nearly the same length, means the formulas agree and the estimate is reliable. A wide spread means the formulas diverge significantly, which happens most severely at high rep counts (12+) where individual variation in strength endurance makes population-average charts unreliable for any specific lifter. The research on individual variation in reps per percentage confirms that above 10 reps, the range of reps people can actually do at a given percentage becomes large enough that any average estimate should be treated with real caution. At 1–5 reps, the formulas converge, and the average is their most trustworthy. For the full accuracy context, see How Accurate Are 1RM Calculators?
Why Use the Average Rather Than a Single Formula?
No single formula is most accurate across all lifts, rep counts, and populations. Epley performs well on the squat; Mayhew is calibrated for bench press. Lombardi's power function is more conservative at high reps; Epley and Brzycki can overestimate there. The average of all seven reduces the influence of any individual formula's assumptions. A wide bar chart signals that the average itself is less meaningful at that rep count, which is information no single-formula calculator conveys.
The Seven Formulas: What This Converter Uses
The seven formulas that power every calculation in this converter represent the full published body of 1RM prediction research. Each uses a different mathematical model and was developed from different populations and testing contexts.
| Formula | Model Type | Characteristic at High Reps | Notes |
| Epley (1985) | Linear additive | Grows without limit | Most widely used; adds ~3.33% per rep |
| Brzycki (1993) | Linear denominator | Breaks down above 37 reps | Often agrees with Epley at moderate reps |
| Lander (1985) | Linear denominator | Aggressive above 10 reps; breaks at ~38 | More conservative than Epley at low reps |
| Lombardi (1989) | Power function (r^0.10) | Most conservative at high reps | Grows more slowly than all additive formulas |
| Mayhew (1992) | Exponential decay | Bounded upper limit | Calibrated for bench press; not valid at r=1 or r=2 |
| O'Conner (1989) | Linear additive | Lowest estimate at 5–11 reps | Adds 2.5% per rep; always below Epley |
| Wathan (1994) | Exponential decay | Similar profile to Mayhew | Generally higher than Mayhew at moderate reps |
The Rep-to-% Reference Table
This table shows the 7-formula average percentage and the corresponding weight for key rep counts, based on a 140 kg 1RM at 5 kg rounding. Use the RM Table mode to generate this table for your own 1RM instantly. For the full reference treatment, see the Rep Max Equivalency guide.
| Reps | Average % of 1RM | Weight (140 kg 1RM) | Training Zone |
| 1 | 100% | 140 kg | Maximal Strength |
| 2 | ~95% | ~133 kg | Maximal Strength |
| 3 | ~92% | ~129 kg | Maximal Strength |
| 4 | ~88% | ~123 kg | Strength |
| 5 | ~85% | ~119 kg | Strength |
| 6 | ~83% | ~116 kg | Strength |
| 7 | ~80% | ~112 kg | Hypertrophy |
| 8 | ~78% | ~109 kg | Hypertrophy |
| 10 | ~74% | ~104 kg | Hypertrophy |
| 12 | ~70% | ~98 kg | Hypertrophy |
| 15 | ~65% | ~91 kg | Muscular Endurance |
| 20 | ~58% | ~81 kg | Muscular Endurance |
Averages across all 7 formulas at representative rep counts. Individual formula outputs vary; enter your own 1RM above to generate exact figures and the full bar chart breakdown.
RM Table Mode: Your Complete Rep-Max Reference
How to Build the Table?
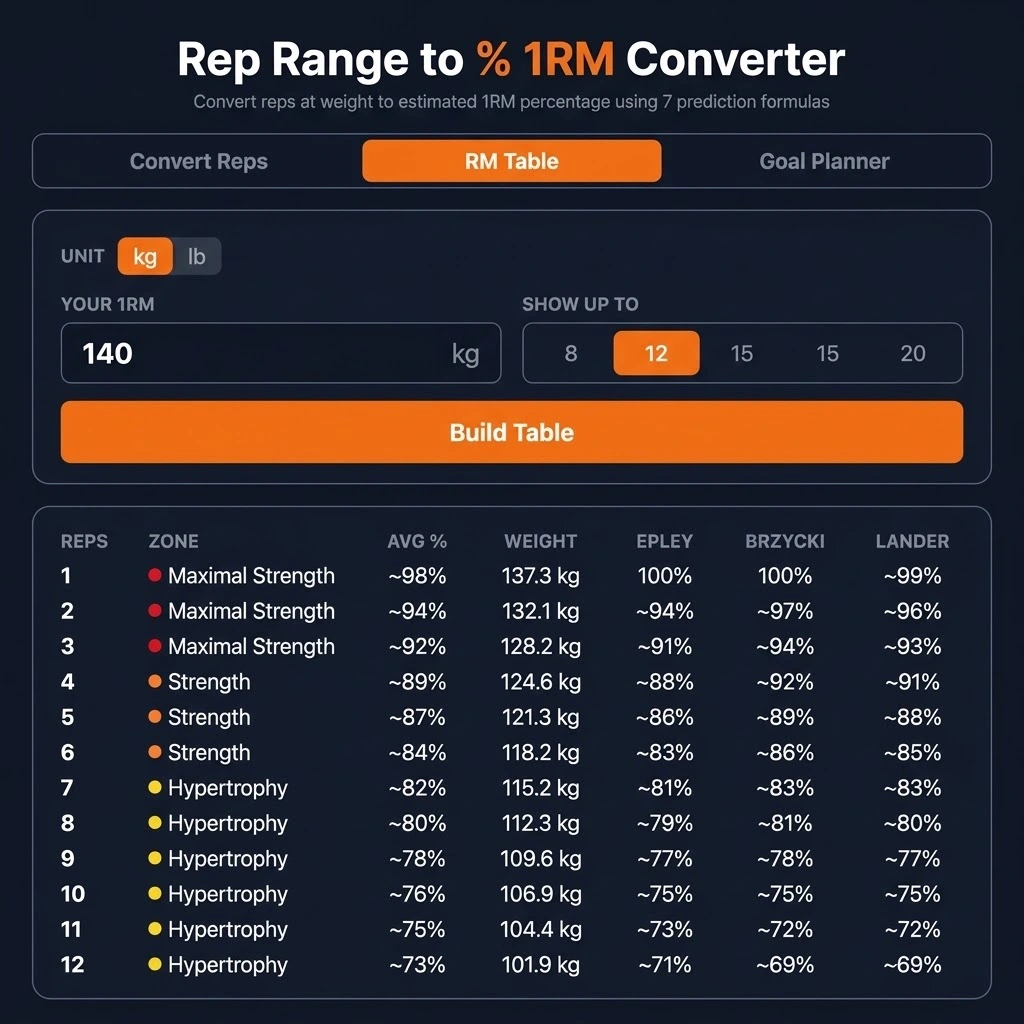
Enter your 1RM in the RM Table tab. Choose the number of rows: 8 (covering the most common strength and hypertrophy rep counts), 12 (extending into the upper hypertrophy range), 15 (reaching the muscular endurance zone boundary), or 20 (the full range including high-rep conditioning). Press Build Table. The table generates instantly, showing every rep count from 1 to your chosen limit in a single reference.
Reading the Table: Zone Color Dots and Formula Columns
Each row contains: the rep count; a color-coded zone dot with the zone name (matching the Training Zone Spectrum visual); the 7-formula average percentage in bold; the target weight in your chosen unit (the average percentage × 1RM, rounded to your selected increment); and individual formula columns for Epley, Brzycki, and Lander as a representative sample of the formula spread. The individual columns show, without the bar chart, how the three most widely cited formulas compare at each rep count.
Choosing How Many Rows
The row count determines how far into the rep range the table extends:
- 8 rows: covers reps 1 to 8: the primary strength and strength-hypertrophy range. Best for powerlifters and strength-focused athletes.
- 12 rows: extends to the top of the hypertrophy zone. The most commonly useful table for mixed strength and hypertrophy programming.
- 15 rows: reaches the muscular endurance zone boundary. Useful for periodization blocks with high-rep back-off sets.
- 20 rows: the full available range. Useful for general fitness athletes, circuit training contexts, or complete program planning.
Goal Planner Mode: Training Goals Mapped to Your 1RM
How Does the Goal Planner Work?
Enter your 1RM and press Show Goals. The calculator generates four goal cards, one per training category, each showing the relevant rep range, the approximate percentage of 1RM for that zone, and a list of individual rep counts with their estimated weights. The cards are instantly scanable: a lifter planning a hypertrophy block can go straight to the hypertrophy card and read off the weights for 8, 9, 10, 11, and 12 reps without any additional calculation.
| Goal Card | Rep Range | % of 1RM | Primary Stimulus |
| 💪 Powerlifting / Max Strength | 1–3 reps | ~90–100% | Maximal neural activation; absolute strength |
| 🏋️ Strength | 3–6 reps | ~80–90% | High-force output; strength with manageable fatigue |
| 📈 Hypertrophy | 6–12 reps | ~65–80% | Muscle growth through mechanical tension and metabolic stress |
| 🔄 Muscular Endurance | 13–20 reps | ~50–65% | Lactate tolerance; muscle endurance capacity |
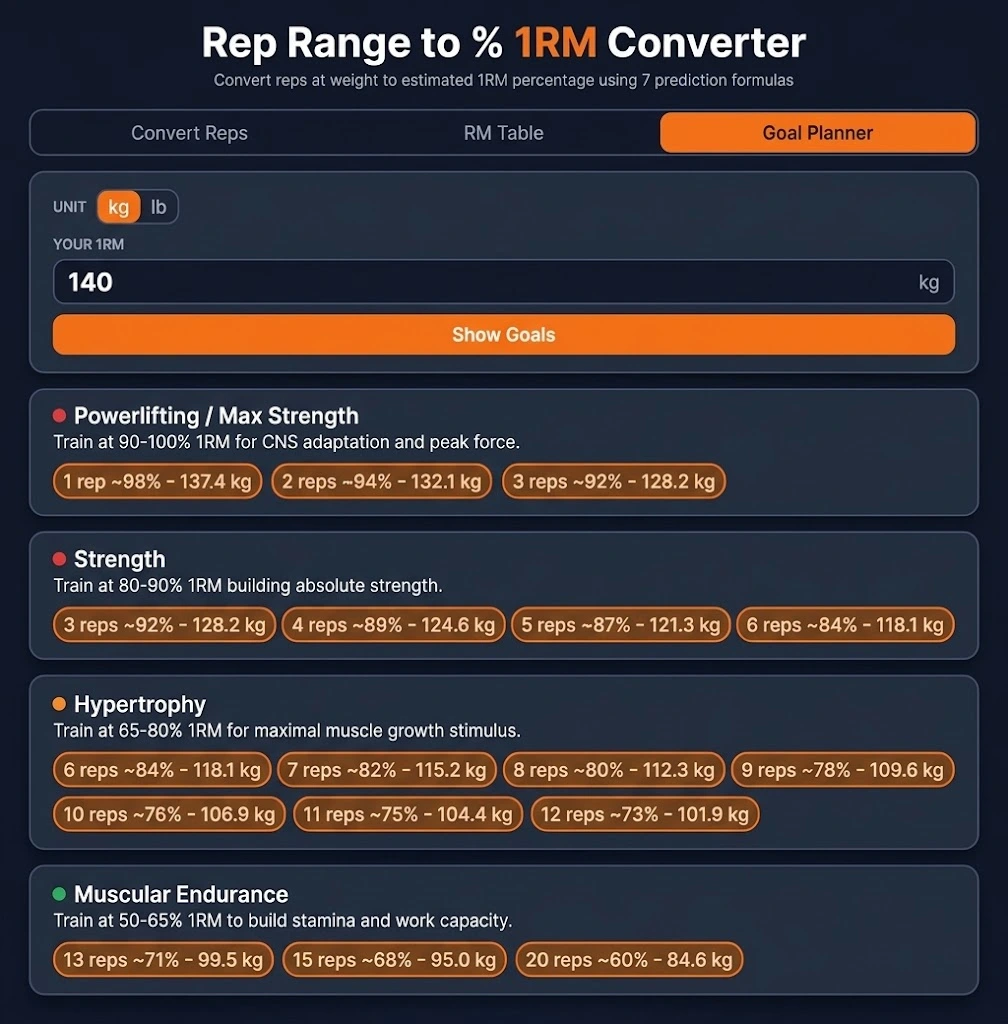
Powerlifting / Max Strength (1–3 Reps)
The 1–3 rep card shows weights for true singles, doubles, and triples at 90–100% of 1RM. This is the domain of competitive powerlifting. Sets here are high-effort, demand full technical control, and require 3–5 minutes between efforts. The Goal Planner shows specific weights for each rep count so lifters can plan attempt progressions for a mock meet or test session. The 1-rep result always displays exactly 100%, with no tilde.
Strength (3–6 Reps)
The 3–6 rep card covers the primary strength training range: heavy enough to drive meaningful neural adaptation, with enough reps per set to accumulate volume. Most traditional strength programs operate in this zone. Weights here represent approximately 80–90% of 1RM. The % of 1RM Calculator can generate a full table at these intensities for any percentage-based program.
Hypertrophy (6–12 Reps)
The 6–12 rep card is the most commonly used zone in recreational strength training. The ACSM position stand on progression in resistance training and subsequent research consistently identify the 6–12 rep range at 65–80% of 1RM as the primary mechanical tension zone for muscle growth. The Goal Planner shows weights for each individual rep count in this range, useful for program writing that specifies "3 sets of 8–12" and lets the lifter work within a weight band rather than a fixed load.
Muscular Endurance (13–20 Reps)
The 13–20 rep card shows weights in the 50–65% of 1RM range: lighter, higher-rep sets that develop lactate tolerance, local muscular endurance, and cardiovascular fitness alongside strength maintenance. This zone appears in general fitness programming, rehabilitation contexts, and as back-off work in some powerlifting periodization models, typically bodybuilding-style volume work on accessory lifts after the main strength work.
Using Goal Cards to Plan a Training Block
If you're designing a 12-week block with a 4-week hypertrophy phase, a 4-week strength phase, and a 4-week peaking phase, use the Goal Planner to see the weight ranges for each phase at your current 1RM. Start with the Hypertrophy card weights for weeks 1–4, move to the Strength card for weeks 5–8, and peak with the Powerlifting card for weeks 9–12. For the full block structure, see Strength Training Programming.
The Five Training Zones in Detail
| Zone | Rep Range | Approx. % of 1RM | Colour | Primary stimulus |
| 🔴 Maximal Strength | 1–3 | ~90–100% | Red | Maximum motor unit recruitment; neural efficiency |
| 🟠 Strength | 4–6 | ~80–90% | Orange | High-force output with manageable cumulative fatigue |
| 🟡 Hypertrophy | 7–12 | ~65–80% | Yellow | Mechanical tension and metabolic stress combined |
| 🟢 Muscular Endurance | 13–20 | ~50–65% | Green | Lactate threshold; slow-twitch fibre endurance |
| 🔵 Cardiovascular Endurance | 21+ | below 50% | Blue | Aerobic capacity; local muscle fatigue resistance |
Zone boundaries are guidelines: research supports significant overlap between adjacent zones, and individual response varies substantially.
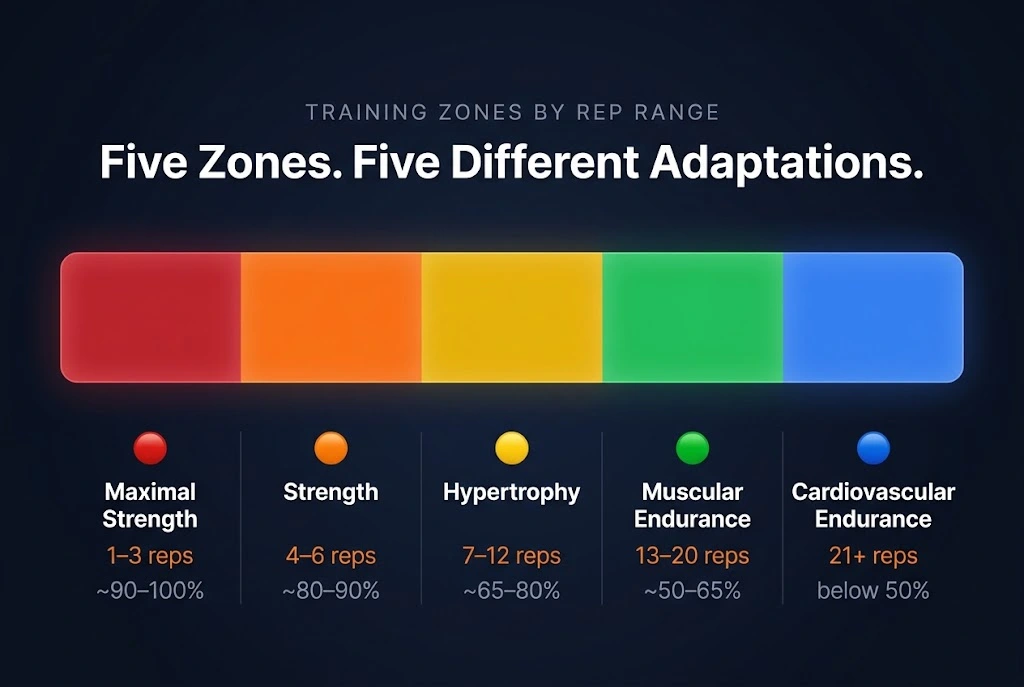
Why These Zone Boundaries Exist
Zone boundaries reflect where the primary training stimulus shifts physiologically. Below 3 reps at above 90% of 1RM, the limiting factor is almost entirely neuromuscular: the muscle doesn't work long enough to accumulate metabolic stress. Above 12 reps at below 65% of 1RM, the limiting factor increasingly shifts from force production to endurance of repeated contractions. The overlap zones (4–6 reps, 7–12 reps) are where dual adaptations occur, which is why 5-rep work builds both strength and some muscle simultaneously.
The Cardiovascular Endurance Zone: 21+ Reps
The fifth zone, covering 21+ reps, is unique to this calculator; none of the other tools on this site extend this high. At below 50% of 1RM, work here trains local muscle endurance and aerobic capacity more than maximal strength or hypertrophy. This is the domain of circuit training, high-rep conditioning, and rehabilitation protocols. Formula accuracy at 21+ reps is the lowest across all zones: treat any percentage estimate in this zone as a rough guideline only, not a precise prescription.
How Does This Converter Fit with the Other Calculators?
Step 1: Find Your 1RM First
This converter requires a 1RM input to generate weights. Without a tested 1RM, use the one rep max calculator to estimate one from any multi-rep set. Once you have your estimated maximum, return here and use it as the basis for the Convert Reps, RM Table, or Goal Planner output.
Use the % of the 1RM Calculator for the Full Picture
This converter moves from rep count toward percentage. The % of 1RM Calculator moves in the other direction, from percentage toward weight. Together they form a complete bidirectional lookup system: use this tool to understand what zone a set falls in, then use the % of 1RM Calculator to generate the precise weights for every percentage in that zone.
Use the Training Max Calculator for Program Setup
If your program uses a training max (5/3/1 and similar), use the Training Max Calculator to set your TM percentage. The rep-to-% converter then adds context for any given week's top set, showing where it sits in the training zone spectrum, something the TM calculator alone doesn't supply.
Pair with the RPE Calculator for Autoregulation
The RPE Calculator answers "How hard did that set actually feel?"—the complement to this converter's "what percentage is that rep count?" When the RPE and percentage estimates agree (8 reps at approximately 78% feels like RPE 8), the estimate is well-calibrated. When they diverge, it signals fatigue or a 1RM that needs updating.
Technical Notes
How the Average is Computed?
The seven formulas are each evaluated at the input rep count. Invalid outputs are excluded before averaging: Brzycki becomes invalid above 37 reps (denominator approaches zero) and is excluded from the average beyond that point. Lombardi's power function (r^0.10) is always defined for positive rep counts. Mayhew and Wathan use exponential functions that remain valid across all rep counts. The arithmetic mean of all valid formula outputs is the displayed value.
Validation Rules and Edge Cases
| Input / Situation | Behavior |
| Rep count = 1 | Displays exactly 100%; no tilde prefix |
| Rep count > 36 | Brzycki excluded from the average (denominator near zero). |
| Rep count 21+ | Cardiovascular endurance zone applied; wide formula divergence expected |
| 1RM = 0 or negative | Input rejected; error displayed inline |
| Weight = 0 (Reps + Weight mode) | Input rejected; error displayed inline |
| Very high rep counts (20+) | Average shown with tilde; individual formula spread is very wide: treat estimate with caution. |