
1RM Formulas & Calculations
You’ve entered the same weight and rep count into two different 1RM calculators and gotten two different numbers. That’s not a calculator error. Each tool uses a different formula, and the seven 1RM formulas in our one rep max calculator can produce estimates that disagree by 5–10 kg at higher rep counts from the exact same input. This guide covers how each formula works and which to trust for your lift.
What Is a 1RM Formula?
Every 1RM calculator takes two inputs: the weight on the bar and how many reps you completed. The formula applies a mathematical scaling factor to those numbers and returns a prediction of the heaviest single you could have lifted that day.
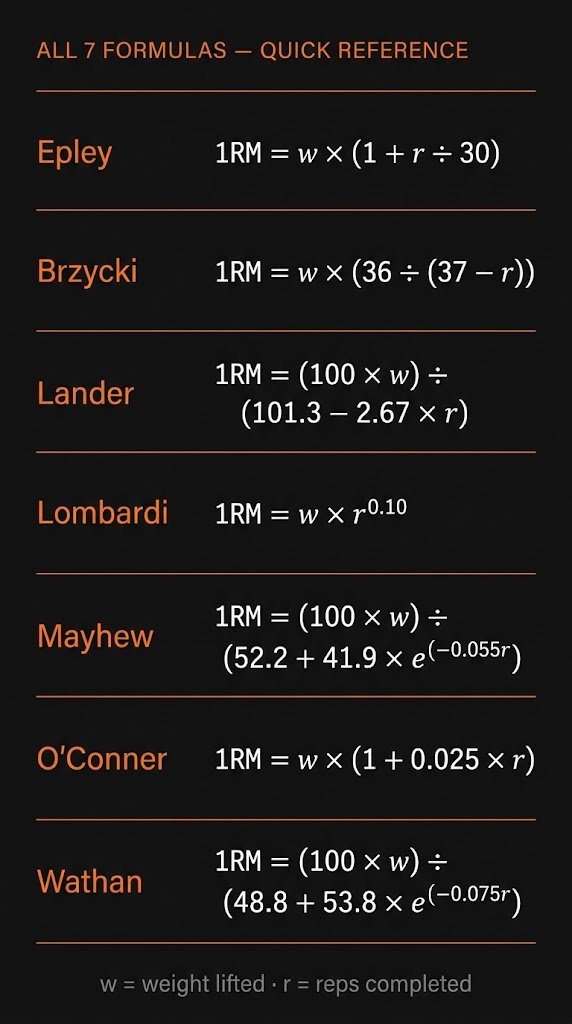
All seven formulas in this calculator share that input structure, but the math differs. Epley (1985) adds roughly 3.3% per rep through a linear factor. Brzycki (1993) applies a ratio that behaves similarly at low reps but compresses at higher counts. Lombardi (1989) uses a power function. Mayhew (1992) and Wathan (1994) use exponential decay models. Each was built from a different population of lifters, tested on different exercises, and published independently across a nine-year span.
That origin gap is why they disagree. Mayhew’s data came from bench press testing at a university lab. Epley’s came from strength athletes at the University of Nebraska. None of the researchers had access to each other’s datasets, and none of the resulting formulas covers every lift equally well. At 3 reps, all seven agree within about 2%. At 10 reps, the spread can reach 8 kg on a 100 kg input.
The Epley Formula
In 1985, a strength coach at the University of Nebraska built this formula from data on college football players and competitive lifters. The notation is 1RM = w × (1 + r ÷ 30). Multiply the weight you lifted by one plus your rep count divided by thirty. Squat 140 kg for 4 reps, and Epley gives you 140 × (1 + 4/30) = 158.7 kg.
It’s the most widely used 1RM formula in general-purpose calculators, and for good reason: it tracks tested maxes well in the 1–6 rep range on compound barbell lifts. Past about 8 reps it starts reading high, especially on bench press, where fatigue curves differ from lower-body movements. Our calculator defaults to Epley for squat and deadlift but switches to Mayhew for bench.
For the worked examples, accuracy data by rep range, and the specific lifts where Epley overestimates: Epley Formula: Complete Guide
The Brzycki Formula
At 3 reps, Brzycki and Epley agree within a kilogram. At 10, Brzycki reads 3–4 kg lower. That divergence is the main reason this formula exists as a counterpoint in any multi-formula calculator.
Matt Brzycki published it in 1993. The notation is 1RM = w × (36 ÷ (37 − r)). The denominator shrinks as reps increase, but at a slower rate than Epley’s linear factor, which makes Brzycki’s output increasingly conservative at higher rep counts. For lifters who find that Epley consistently overestimates their tested max, Brzycki is the first formula to try. It’s also the one most often cited in NSCA-aligned programming literature, and our calculator uses it as the automatic comparison against whichever formula is selected as the primary, so you always see both numbers side by side.
For the full comparison with Epley across rep ranges and the data behind the divergence: Brzycki Formula: Complete Guide
The Lombardi Formula
Where Epley and Brzycki both use addition or a ratio to scale reps into a predicted max, Lombardi (1989) uses a power function: 1RM = w × r^0.10. The exponent is small enough that each additional rep adds diminishing weight to the estimate, which keeps the output from inflating the way additive formulas can at higher rep counts.
That makes Lombardi one of the more conservative formulas in the engine. A 100 kg × 10 set gives 126.0 kg under Lombardi, compared to 133.3 kg from Epley. If you regularly test your maxes and find calculator estimates running 5–8% high, Lombardi’s restraint might match your actual numbers better than the more aggressive models.
For the mathematical breakdown and the specific rep ranges where Lombardi’s power function behaves differently from linear models: Lombardi Formula: Complete Guide
The Mayhew Formula
This one was built from bench press data. Mayhew et al. (1992) derived the formula after testing college-age male subjects primarily on the bench: 1RM = (100 × w) ÷ (52.2 + 41.9 × e^(−0.055 × r)). The exponential term in the denominator flattens the curve at higher rep counts, preventing the runaway inflation that Epley produces above 8 reps.
Our calculator defaults to Mayhew for bench press because of that bench-specific derivation. On squat and deadlift, it performs about the same as the other exponential formula in the engine (Wathan), so the advantage is specific to pressing movements. If you’re programming upper-body work off your calculator estimates and the numbers consistently run high, Mayhew is worth switching to as your primary.
For the dataset behind the formula, how it compares to Epley on bench, and why it doesn’t transfer as cleanly to lower-body lifts: Mayhew Formula: Complete Guide
The Lander Formula
Lander (1985) takes a different structural approach: 1RM = (100 × w) ÷ (101.3 − 2.67123 × r). Instead of multiplying weight by a rep factor, it divides weight by a percentage that drops linearly with each rep. Each rep costs you roughly 2.67% of your estimated max, and you can check the arithmetic on paper without computing an exponential.
In practice, Lander tracks close to Epley at 5 reps (both return 116.7 kg for 100 × 5) and starts pulling slightly lower at higher counts. It’s the formula with the most transparent math in the set. If you want to understand exactly where the estimate came from without trusting a decay curve, Lander shows you directly.
For the full derivation and how Lander’s linear percentage model compares to exponential approaches at different rep counts: Lander Formula: Complete Guide
The O’Conner Formula
If you want a floor estimate, this is the one to use.
O’Conner (1989) gives 1RM = w × (1 + 0.025 × r). The structure looks like Epley’s, but the growth factor is smaller: 0.025 per rep instead of 0.033. That 25% difference in the per-rep factor compounds across a set, which is why O’Conner consistently returns the lowest 1RM estimate of any formula in the calculator. For a 100 kg × 5 set, O’Conner gives 112.5 kg. Epley gives 116.7 kg. That 4.2 kg gap is meaningful when you’re using the number to set top-set loads.
Lifters who prefer to program off conservative numbers, or who find their actual tested maxes reliably falling below calculator estimates, should look at O’Conner first. It won’t give you an ego number, but it won’t set you up to miss reps either.
For the worked comparison and the specific situations where a floor estimate is more useful than an average one: O’Conner Formula: Complete Guide
The Wathan Formula
Wathan (1994) uses an exponential model structurally similar to Mayhew’s: 1RM = (100 × w) ÷ (48.8 + 53.8 × e^(−0.075 × r)). The denominator’s decay means the scaling slows down at higher rep counts rather than continuing linearly, which keeps the estimate from running away past 10 reps the way Epley’s does.
At 5 reps, Wathan produces estimates nearly identical to Epley and Lander (116.8 kg for a 100 kg input). The difference shows up at 10+ reps, where Wathan sits between Epley and the more conservative formulas. Of the seven in the calculator, it probably has the flattest accuracy profile from 1 to 12 reps. That doesn’t make it the best formula. It makes it the one least likely to be wildly off at any particular rep count.
For the accuracy breakdown across rep ranges and how Wathan compares to Mayhew’s similar exponential structure: Wathan Formula: Complete Guide
All 7 Formulas Compared: Which Is Most Accurate?
No formula wins across all lifts and rep ranges. The question only has a useful answer when you pin down the lift, the rep count, and what “accurate” means to you.
At 5 reps, the entire set produces estimates within a 5 kg window for a 100 kg input. At 10 reps, that spread more than doubles:
| Formula | 100 kg × 5 reps | 100 kg × 10 reps |
| Epley | 116.7 kg | 133.3 kg |
| Brzycki | 116.3 kg | 130.6 kg |
| Lander | 116.7 kg | 131.7 kg |
| Lombardi | 115.7 kg | 126.0 kg |
| Mayhew | 115.1 kg | 128.1 kg |
| O’Conner | 112.5 kg | 125.0 kg |
| Wathan | 116.8 kg | 131.6 kg |
Formula outputs cluster tightly at 5 reps and diverge at 10. Use a 3–5 rep input for the most reliable estimate.
If you’re choosing a single formula, Epley is the safe general-purpose default at low rep counts. Mayhew is the better pick for bench press. O’Conner gives you a built-in safety margin. The most reliable approach is to use a low-rep input set and treat the spread between formulas as your confidence interval rather than picking one number to live by.
For the full accuracy analysis by lift type, rep range, and individual body type: All 1RM Formulas Compared: Which Is Most Accurate?
How to Calculate Your Percentage of 1RM
The 1RM estimate isn’t the number you put on the bar. It’s the reference point you calculate your working weights from. When a program calls for 4 sets of 5 at 80%, that percentage is anchored to your 1RM, and the estimate you just ran through the calculator is what makes it into an actual plate count.
Two benchmarks cover most programming needs: your 5-rep max sits around 85% of your 1RM, and your 10-rep max around 75%. Those aren’t exact (individual fatigue profiles shift them by a few percent either way), but they’re consistent enough to program from. Training max programs like 5/3/1 add another layer by anchoring percentages to 90% of your estimated 1RM rather than the full number, building in a recovery buffer across the cycle.
The calculator’s Percentage & Rep-Max Table generates the full chart for you. Enter your set, get your 1RM, and the table reads out target weights at every 5% increment from 50% to 100%, plus predicted rep maxes for 1 through 12. Toggle the Training Max switch to base everything on 90% instead.
For the full percentage chart, how training maxes adjust the math, and how to apply it across different programs: How to Calculate % of 1RM for Any Rep Range
RPE: The Alternative to Fixed Percentages
Fixed percentages assume your 1RM stays constant week to week. It doesn’t. Sleep, nutrition, accumulated fatigue, and stress shift your daily capacity by 3–5% in either direction, and percentage-based programs can’t account for that variation on their own.
RPE (Rate of Perceived Exertion) solves this by prescribing effort levels instead of absolute loads. The scale runs from 1 to 10 for strength work, where RPE 10 means no reps were left in reserve, RPE 9 means one more was there, and RPE 8 means two. A program that calls for “3 sets of 4 at RPE 8” is telling you to stop each set with about two reps left, regardless of what the bar weighs that day. The weight adjusts itself to your readiness.
Most advanced programs don’t choose between RPE and percentages. They use both: percentage-based volume work at 75–80% to build tonnage, then RPE-driven work as you approach a peak. For how RPE connects to the rest of your 1RM-based programming, the One Rep Max Basics guide covers the full picture.
For the full RPE chart, the RIR conversion table, and how to integrate RPE into percentage-based programs: RPE Scale Explained for Strength Athletes
How to Use the 1RM Calculator With These Formulas
Select your lift from the dropdown, enter the weight and reps from your last hard set, and the one rep max calculator returns your estimated 1RM from all seven formulas at once. The spread between them tells you how much confidence to place in any single number.
If one formula consistently matches your tested maxes better than the others, you can lock to it using the formula selector. For most lifters, the default assignments (Epley for squat, Mayhew for bench) are the right starting point. From there, the Percentage & Rep-Max Table converts your 1RM into a full training load chart.
Frequently Asked Questions
Key Takeaways
Seven formulas, one set of inputs, and a spread of outputs that narrows at low reps and widens past ten. The practical lesson: use a 3–5 rep set for your input, check the full range of estimates rather than locking to one number, and pick the formula that matches your tested maxes most consistently. The math is settled. The question is which dataset fits you.
Next, explore the full guides in this series:
- Epley Formula: Complete Guide
- Brzycki Formula: Complete Guide
- Lombardi Formula: Complete Guide
- Mayhew Formula: Complete Guide
- Lander Formula: Complete Guide
- O’Conner Formula: Complete Guide
- Wathan Formula: Complete Guide
- All 1RM Formulas Compared: Which Is Most Accurate?
- How to Calculate % of 1RM for Any Rep Range
- RPE Scale Explained for Strength Athletes