
Rep Max Equivalency: 1RM to 5RM to 10RM
You know your 1RM, but your program asks for a 5RM weight, or you know your 5RM and need a 1RM to set training percentages. The rep max equivalency chart bridges those two numbers. This article delivers the complete chart, worked conversions for the most common rep maxes (1RM, 3RM, 5RM, 8RM, 10RM), the reverse conversion table most calculators skip, and the part almost every competing article leaves out: why these percentages are approximations rather than fixed laws.
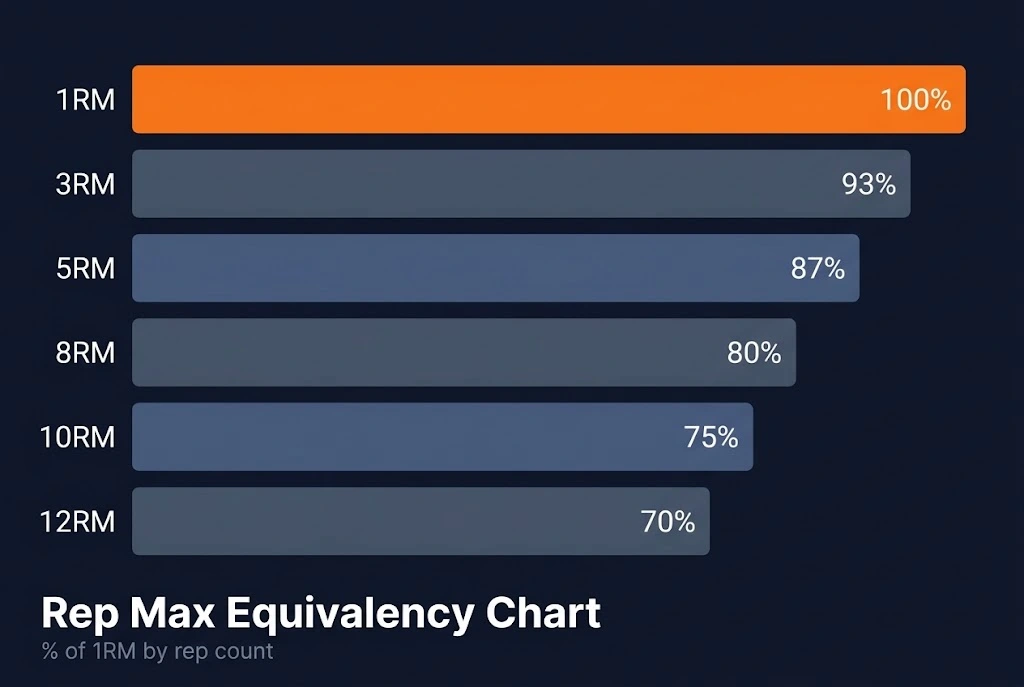
The Rep Max Equivalency Chart
The percentages below come from 1RM estimation formulas, primarily the Epley method and the NSCA Training Load Chart, and represent the average relationship between rep count and percentage of maximum load across trained athletes. They are averages, not guarantees. Individual results vary enough to matter, which a later section covers in full. For how the underlying estimation math works, see How to Calculate Your One Rep Max.
The Standard Rep Max Percentage Table
| Reps (RM) | % of 1RM | 1RM Multiplier | Training Zone |
| 1 | 100% | 1.000 | Absolute strength |
| 2 | 95% | 1.053 | Maximal strength |
| 3 | 93% | 1.075 | Maximal strength |
| 4 | 90% | 1.111 | Heavy strength |
| 5 | 87% | 1.149 | Strength |
| 6 | 85% | 1.176 | Strength-power |
| 7 | 83% | 1.205 | Strength-power |
| 8 | 80% | 1.250 | Strength-hypertrophy |
| 9 | 77% | 1.299 | Hypertrophy |
| 10 | 75% | 1.333 | Hypertrophy |
| 12 | 70% | 1.429 | Hypertrophy-endurance |
| 15 | 65% | 1.538 | Endurance |
The 1RM Multiplier column converts a known rep max to an estimated 1RM: multiply your RM weight by the multiplier. Example: if your 5RM is 87 kg, multiply by 1.149 to get an estimated 1RM of 100 kg.
Reading the Rep Max Chart Correctly
The chart works in two directions. Read it down to go from a known 1RM to a target rep-max weight: take your 1RM, multiply by the percentage for the rep count you want, and you have the load. A 100 kg 1RM at the 5-rep row (87%) gives an 87 kg target for a 5RM.
Read it up to go the other way. If you know a rep-max weight but not your 1RM, multiply the rep-max weight by the 1RM multiplier for that rep count. An 87 kg 5RM times 1.149 estimates a 100 kg 1RM. The key thing to hold onto: accuracy is highest from 1 to 5 reps and degrades above 10, where muscular endurance starts contributing more to the result than raw strength does. Treat the low-rep rows as reliable and the high-rep rows as rough.
How to Convert Your 1RM to Any Rep Max?
The conversion itself is simple arithmetic. This is the section most readers come for, so here is the formula and a full worked table.
From 1RM to 5RM, 8RM, or 10RM
To convert a 1RM to any rep max, multiply your 1RM by the percentage from the chart. That’s the whole method. The table below runs a 100 kg 1RM through every common rep max so you can see the pattern at a glance.
| Rep Max | Formula | Result |
| 2RM | 100 × 0.95 | 95 kg |
| 3RM | 100 × 0.93 | 93 kg |
| 5RM | 100 × 0.87 | 87 kg |
| 8RM | 100 × 0.80 | 80 kg |
| 10RM | 100 × 0.75 | 75 kg |
| 12RM | 100 × 0.70 | 70 kg |
These are estimates based on average formula outputs. Your actual rep maxes may vary by about 5% depending on lift type, training level, and fibre composition.
Two anchors show up most often in real programs. The 5RM (87% of 1RM) is used in programs like The Rippler and various 5/3/1 variants. The 10RM (75% of 1RM) is the standard hypertrophy anchor. The calculator’s Percentage & Rep-Max Table generates this entire chart automatically from any 1RM you enter.
Reverse Conversion: From a Known Rep Max to 1RM
This is the direction most calculators ignore. If you know your 5RM but never tested a true single, you can still estimate your 1RM: multiply the rep-max weight by the 1RM Multiplier for that rep count. A 5RM of 87 kg times 1.149 gives a 100 kg estimated 1RM.
| Known Rep Max | Multiply by | Estimated 1RM |
| 2RM | 1.053 | × 2RM weight |
| 3RM | 1.075 | × 3RM weight |
| 5RM | 1.149 | × 5RM weight |
| 8RM | 1.250 | × 8RM weight |
| 10RM | 1.333 | × 10RM weight |
Example: if your 5RM on the bench press is 87 kg, your estimated 1RM is 87 × 1.149 = 100 kg.
The calculator does this reverse conversion too. Enter any rep count and the weight you lifted, and it produces an estimated 1RM using all seven formulas at once, which is more reliable than converting from a single multiplier.
Why These Percentages Aren’t Universal
Here is where almost every rep max article stops short. The chart gives population averages, and the variation around those averages is large enough to change your training weights. Some lifters knock out 8 reps at 80% of their 1RM; others grind to a halt at 5. Knowing why the spread exists tells you whether the chart is likely to over- or underestimate your own numbers.
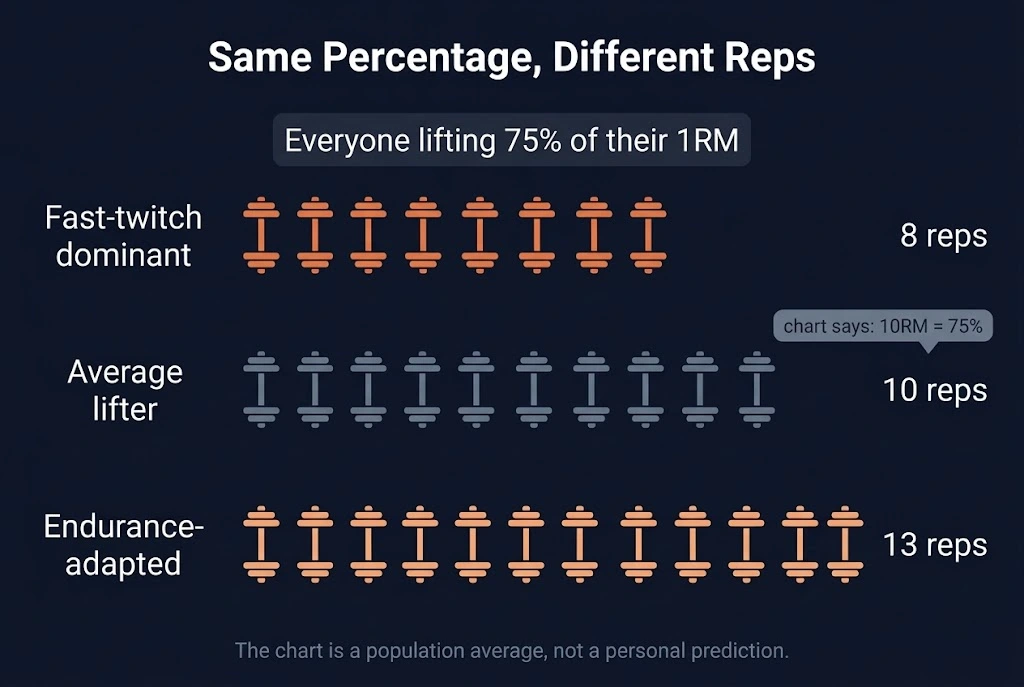
Individual Variation: Why Your Percentages May Differ
The number of reps a lifter can perform at a given percentage of 1RM varies substantially between individuals, often by 3-5 reps at the same percentage. So a chart row reading “10RM = 75%” is better read as “for the average trained lifter, the 10RM is about 75% of 1RM.” A fast-twitch-dominant lifter might manage only 8 reps at 75%, while an endurance-adapted lifter completes 13 at the same load. The research on individual variance in rep max percentages documents just how wide this spread runs. For how this variance feeds into calculator accuracy, see How Accurate Are 1RM Calculators?
Exercise Type Shifts the Curve
Compound lifts that recruit more total muscle mass, like the squat and deadlift, allow more reps at a given percentage than isolation movements like the bicep curl or leg extension. A lifter can complete more reps at 80% of 1RM on a squat than on a curl, because the larger muscle recruitment spreads fatigue across more tissue. The practical consequence: the chart is more accurate for the Big 3 compound lifts, which happen to be the lifts this calculator is built around, than for isolation work. For a curl, treat any chart figure as a loose starting point.
Training Level Changes Your Rep Max Profile
Advanced lifters tend to perform fewer reps at a given percentage than beginners, because they are more neurologically efficient and can express a higher fraction of their true 1RM on any single attempt. A beginner with a 100 kg 1RM might comfortably lift 75 kg for 12 reps; an advanced lifter with the identical 1RM might stop at 8. This is why the chart fits intermediate lifters best, since that is largely the population it was calibrated on, and diverges most for extreme beginners and highly advanced athletes at either end of the efficiency scale.
The Formula Behind the Chart
The percentages aren’t arbitrary. They are the outputs of 1RM estimation formulas run in reverse, which is why different sources publish slightly different charts: they are built on different formulas.
Why Epley, Brzycki, and NSCA Give Slightly Different Numbers
The NSCA chart, the Epley formula, and the Brzycki formula each model the weight-to-reps relationship a little differently. At 5 reps, Epley gives 87.5%, Brzycki gives 86.3%, and the NSCA chart rounds to 87%. The gap is small. At 10 reps, Epley gives 75%, Brzycki gives 73%, and NSCA shows 75%, and the gap has widened. This is the pattern: the formulas agree closely at low rep counts and diverge as reps climb, which is exactly why the chart loses accuracy above 10 reps no matter which formula produced it. Rather than picking one formula as definitive, the calculator runs all seven and shows the spread. For the two most common formulas compared directly, see Epley vs Brzycki Formula Comparison.
The Accuracy Sweet Spot: 1-5 Reps
All seven formulas agree most closely from 1 to 5 reps. Above 5, they start to separate; above 10, the separation becomes practically significant. At 12 reps, the difference between the most aggressive formula (Epley) and the most conservative (O’Conner) can exceed 5 kg for a 100 kg lifter. The takeaway for programming: if you are deriving training weights from the chart, build it from a sub-5-rep input for the most reliable result.
How to Use the Rep Max Chart in Your Programming?
Understanding the chart is one thing; applying it is another. Two common programming scenarios call for rep max conversion directly.
Programming from a Known Rep Max Instead of 1RM
Some programmers prescribe work as a fraction of a specific rep max rather than a percentage of 1RM. “3 sets of 5 at 90% of your 5RM,” or “work up to a heavy 3RM, then do back-off sets.” To follow these, you either know your rep max directly or convert it from your 1RM using the chart.
A worked example. Say your 1RM is 100 kg and the programmer calls for “3 × 5 at 90% of 5RM.” ” First find your 5RM: 100 × 0.87 = 87 kg. Then take 90% of that: 87 × 0.90 = 78 kg. You use 78 kg for the 3 × 5. For why tracking these numbers across a training block matters, see Progressive Overload.
Building Your Personalized Chart with the Calculator
The chart in this article gives population averages. The Percentage & Rep-Max Table in the calculator gives you a version calibrated to your own numbers. Enter your best recent set into the one rep max calculator, get your estimated 1RM, then scroll to the Percentage & Rep-Max Table accordion for your full training load chart across every percentage from 50% to 100%, rounded to practical plate combinations. That personalized chart beats any generic table, because it is built from your data rather than a population average. Beginners working from the chart for the first time may also want 1RM for Beginners.
Frequently Asked Questions
The rep max equivalency chart is a tool, powerful as a starting approximation and misleading if treated as a universal law. Use it to convert between rep maxes and to estimate a 1RM you haven’t tested, then calibrate against your real training data. The calculator generates a personalized chart from your own numbers that outperforms any generic table. Start with the One Rep Max Basics guide for the full context, learn the math in How to Calculate Your One Rep Max, and see where the numbers come from in the Epley vs Brzycki Formula Comparison.