
How Accurate Are 1RM Calculators?
Before you build a training block on a number a calculator gave you, it’s worth asking how accurate are 1RM calculators in the first place. The honest answer: within roughly 3-10%, with the margin depending heavily on the lift, the rep range you used, and factors specific to you. This article covers the peer-reviewed research behind those figures, how the error margin changes by exercise, the four variables that decide where your estimate lands, and what the margin actually means for programming.
How Accurate Are 1RM Calculators? The Research Answer
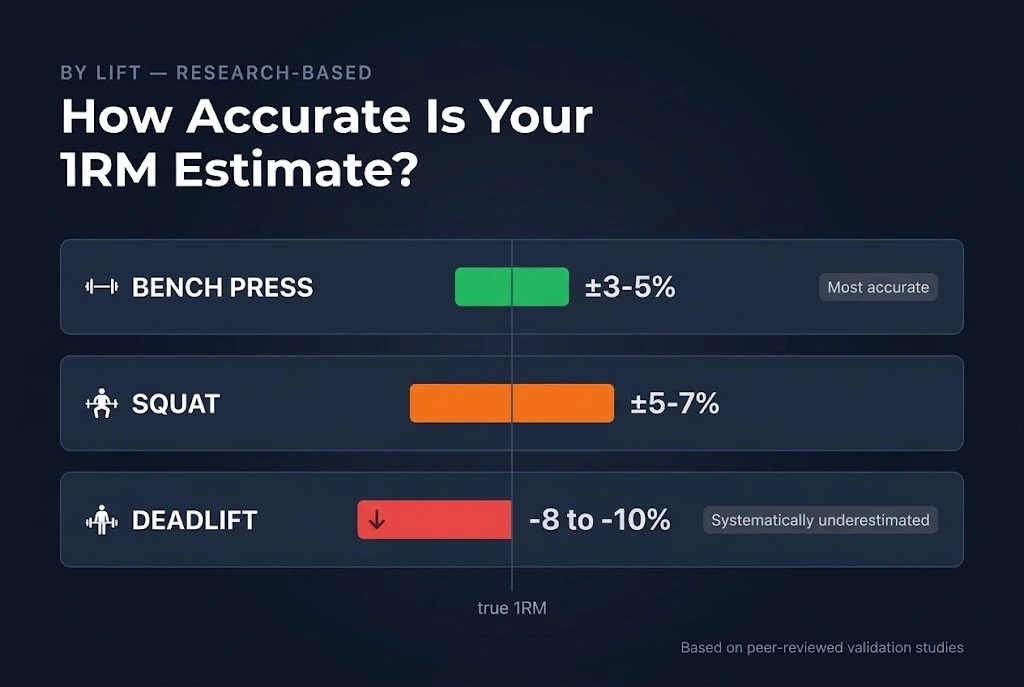
There is no single accuracy number, and any source that gives you one is oversimplifying. The real answer runs on a range: as tight as about 3% for the bench press at 5 reps, as loose as 10% for the deadlift at any rep count. Every figure in this article comes from peer-reviewed validation studies, not marketing claims. The strength and conditioning literature has actually measured this, and the measured numbers are more useful than reassurance.
The Accuracy Range by Rep Count
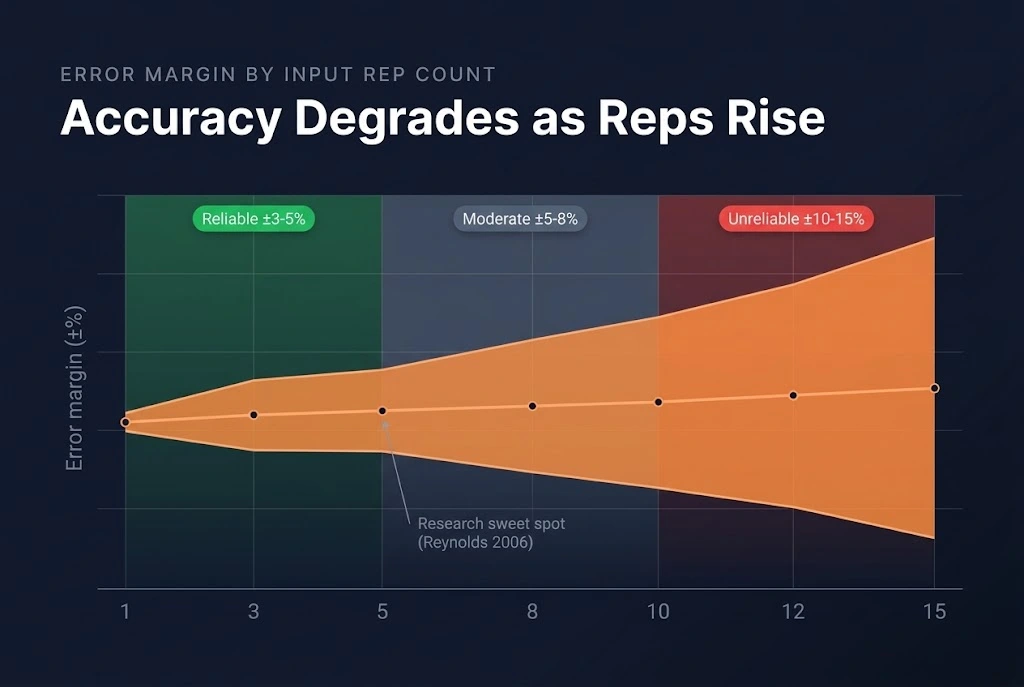
Rep count is the biggest driver of accuracy, and the research-validated pattern is consistent. At 1-5 reps, estimates land within about 3-5% for most compound lifts. At 6-10 reps, accuracy loosens to roughly 5-8%. Above 10 reps, the margin widens to 10-15%, because at that point muscular endurance, fatigue resistance, and psychological grit start determining how many reps you complete more than raw maximal strength does. These are population-level averages. Where your individual estimate falls inside those bands depends on the factors covered later in this article.
What ±5% Actually Means for Your Programming
Put the error margin in real weight. If your true 1RM is 100 kg and the estimate is off by 5%, that’s a 5 kg gap. Program your working sets at 80% and the error propagates to 4 kg, usually less than a single plate increment per side. For a lifter training in the 70-85% range, a 5% estimation error produces weights that are challenging and perfectly usable, not dangerously miscalibrated.
Precision matters more in two situations. Competition attempt selection is one: an opener has to be a near-certain make, and a 3% overestimate can cost you the lift. Peaking programmes are the other. For those cases, consider a direct test. See Why Your 1RM Matters for when testing is worth it, and How to Test One Rep Max Safely for the protocol.
What the Peer-Reviewed Research Shows
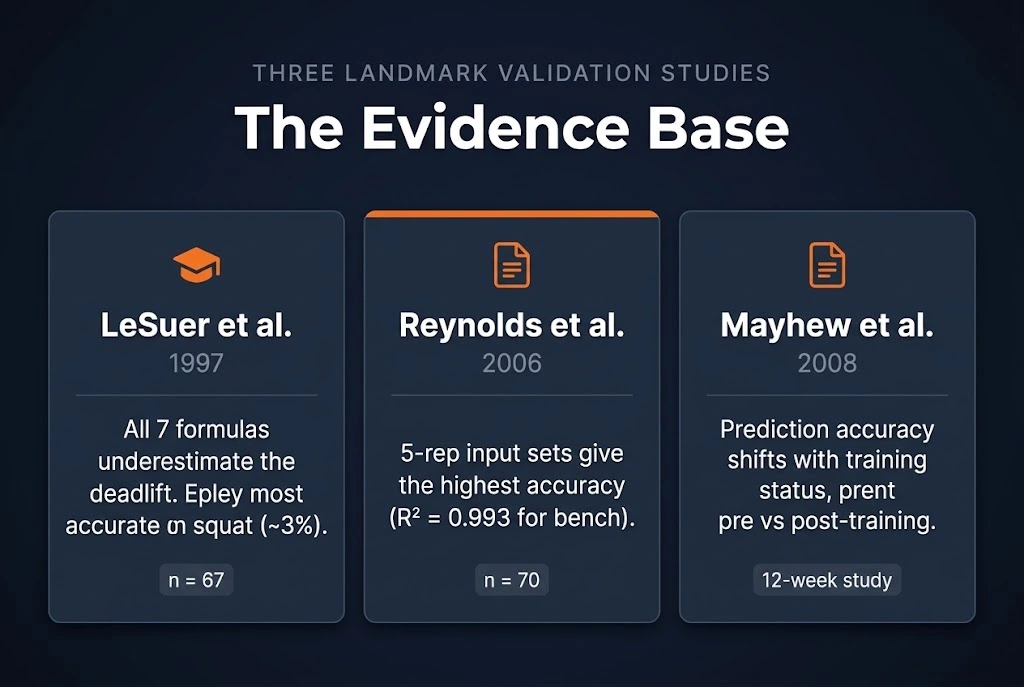
Three validation studies form the evidence base for nearly every accuracy claim about 1RM formulas. Each tested prediction equations against directly measured 1RMs in real populations, and each contributes a finding worth knowing before you trust an estimate. Naming them is the difference between “trust me” and “here’s the data.” For the underlying definition these studies validate, see What Is One Rep Max (1RM)?.
LeSuer et al. (1997): The Landmark Study
LeSuer and colleagues tested seven prediction equations on 67 college students across three lifts: the bench press, squat, and deadlift. Three findings came out of it. First, every formula correlated strongly with the actual 1RM (r greater than 0.95). Second, the Epley formula produced the lowest error on the squat, around 3%. Third, and most important for how you actually use a calculator: all seven equations significantly underestimated the deadlift 1RM.
That deadlift finding is the one to carry with you. It means the deadlift is the single lift where you should treat the calculator’s number as a floor and add 5-10% when setting real targets. For how the two most common formulas differ, see the Epley vs Brzycki comparison. The broader body of validation studies summarised in the research literature reaches the same conclusion about systematic deadlift underestimation.
Reynolds et al. (2006): Why 5 Reps Is the Sweet Spot
Reynolds and colleagues tested 70 participants across four input rep ranges: 1RM, 5RM, 10RM, and 20RM. The 5RM input produced the highest prediction accuracy for the bench press, with an R-squared of 0.993, meaning a 5-rep submaximal set explained over 99% of the variance in actual 1RM. Accuracy dropped off substantially at the higher rep ranges. The takeaway is practical: if you get one shot at calibrating the calculator, use a 5-rep set at genuine maximal effort. That single choice does more for your estimate’s accuracy than any formula selection. The full study is in the Journal of Strength and Conditioning Research: Reynolds et al. (2006).
The Correlation Trap: Why r Greater Than 0.95 Doesn’t Mean What You Think
Here’s the statistical point most sources get wrong. A formula can post a correlation of r greater than 0.95 against real 1RM values, which sounds almost perfect, and still miss any individual lifter’s true max by a meaningful margin. High correlation means the formula reliably ranks lifters in order of strength: stronger lifters get higher estimates, weaker lifters get lower ones. It does not mean your personal estimate sits close to your actual maximum.
The metric that matters for programming is absolute error, the real kilogram gap between the estimate and your true 1RM, and it runs consistently larger than the impressive r-value suggests. When a calculator claims research-backed accuracy on the strength of a correlation coefficient, this is the gap between what the statistic says and what you get.
How Accuracy Varies by Exercise
The accuracy of a 1RM formula isn’t uniform across lifts, which is the part most competing articles skip. The differences are large enough to change how you use the output depending on which lift you entered. A bench press estimate and a deadlift estimate from the same calculator do not deserve the same level of trust.
Bench Press: The Most Accurately Predicted Lift
The bench press consistently posts the smallest prediction error in validation studies, typically 3-5% at 1-5 rep inputs. There’s a structural reason: bench press performance is relatively stable session to session, and the Mayhew formula was derived specifically from bench press data. The calculator reflects this by pre-selecting Mayhew when you choose bench from the dropdown. Practically, your bench estimate is the one you can take most directly to programming without a mental adjustment.
Squat: Moderate Accuracy, Epley Performs Best
Squat estimates are moderately accurate, usually 5-7% at low rep inputs. Epley performs best here, the roughly 3% squat error LeSuer et al. reported. The squat’s greater muscle mass and bilateral loading make performance more variable between sessions than the bench, which widens the error band. Treat squat estimates as reliable for day-to-day programming, but re-test more often than bench if you need precision, such as during meet preparation.
Deadlift: Systematically Underestimated by Every Formula
The deadlift breaks the pattern. LeSuer et al. found that all seven tested equations underestimated the deadlift 1RM, and not randomly, but systematically in the same direction. The likely mechanism is technique: the deadlift permits more optimisation under near-maximal load than other lifts, so a lifter’s true-max deadlift technique often looks different from their submaximal technique. Formulas built on submaximal data can’t see that gap, so they consistently read low. The practical adjustment is simple and worth repeating: add 5-10% to the calculator’s deadlift output when setting competition openers or peaking targets. It is the one lift where the raw number understates you.
The 4 Factors That Determine Your Estimate’s Accuracy
Formula choice is not the only thing setting your estimate’s accuracy. Four variables do most of the work, and the first two are entirely within your control.
1. Rep Range Used for the Input Set
This is the most controllable accuracy factor by a wide margin. The research is consistent: 1-5 reps gives the most accurate estimate, 6-10 reps is moderately accurate, and above 10 reps the reliability falls away. At 12-15 reps, endurance and fatigue resistance dominate the set, and the formula can overestimate your true 1RM by 10-15%. For the full breakdown of how rep count maps to percentage of max, see Rep Max Equivalency.
2. Whether the Set Was Taken to True Failure
Formulas assume your input set ended at or near true muscular failure. Most training sets don’t. If you stop with 2-3 reps in reserve, which is normal and often correct, the formula reads a weaker set than your muscles are capable of and underestimates accordingly. The gap between “reps I did” and “reps I could have done” is invisible to the math. This is what the calculator’s RPE section corrects for: enter how hard the set felt, and it adjusts for the reps you left in the tank.
3. Individual Muscle Fibre Composition
Two lifters with identical training histories and the same true 1RM can get different calculator outputs from the same rep-based input, and fibre composition is why. Fast-twitch dominant athletes produce more force per rep but fatigue faster, so their submaximal performance at a given percentage of 1RM sits below average. Formulas built on mixed populations therefore underestimate fast-twitch athletes and overestimate slow-twitch ones. If the calculator reliably reads below your tested 1RM, fast-twitch dominance is a likely explanation. Beginners still learning their profile can start with 1RM for Beginners.
4. Day-to-Day Readiness Variation
An estimate pulled from a session where you’re fatigued, under-slept, or still recovering from a previous heavy day will read low. This isn’t the formula failing. It’s accurately reflecting your strength on a below-par day, which simply isn’t your true ceiling. The fix is to time your estimation set for a day of full recovery, ideally after a deload or a lighter week, so the number reflects your capacity rather than your fatigue.
Why This Calculator Shows 7 Formulas, and How to Read the Spread
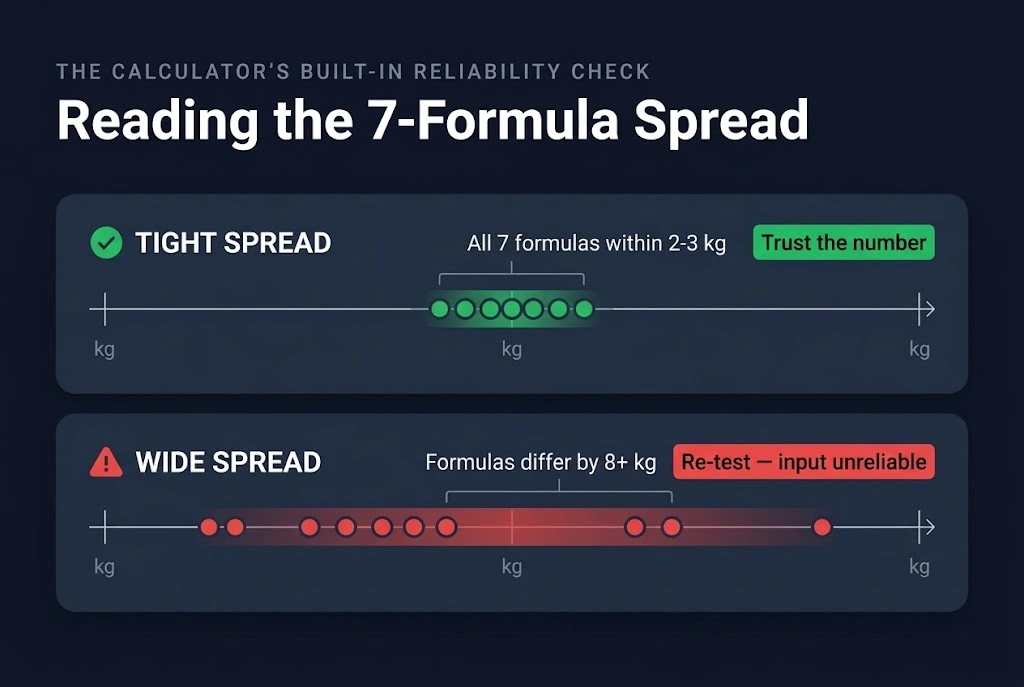
Most calculators show one formula’s output and call it your 1RM. This one runs all seven at once. That’s not a gimmick or a feature for its own sake. It’s the more honest and more accurate approach, and the spread between the formulas carries information a single number can’t.
A Wide Spread Is a Warning Signal
When the seven formulas disagree by more than 5-8 kg, the calculator is telling you the input set didn’t produce reliable data. The usual causes: the rep count was too high (above 8), the set stopped well short of failure, or the weight sat too far from your true 1RM for accurate estimation. A widespread is a built-in reliability check. When you see one, don’t split the difference and average them; retest with a heavier weight for fewer reps. For a deeper look at which formulas behave differently and why, see All 1RM Formulas Compared.
A Tight Spread Means the Number Is Trustworthy
When all seven formulas land within 2-3 kg of each other, your estimate is about as reliable as calculator-based estimation gets. That convergence usually happens with a 3-5 rep input taken close to failure on a compound lift. In that case, use the displayed result directly for programming. No adjustment factor needed.
How to Get the Most Accurate Estimate From the Calculator
Three research-backed steps get the most reliable number out of the one rep max calculator.
- Use a 5-rep input set. Reynolds et al. (2006) found 5-rep submaximal tests produce the highest prediction accuracy. If you have to use a different rep count, stay below 8.
- Take the set close to failure, or use the RPE section. Training to absolute failure every session isn’t practical. When you stop short, enter your effort level in the RPE accordion so the calculator corrects for the reps you left in reserve rather than assuming the set ended at failure.
- Add 5-10% to deadlift estimates. Given the consistent underestimation LeSuer et al. documented, treat any deadlift output as a conservative floor. Start working sets from the raw number, then adjust upward based on how they move.
Frequently Asked Questions
1RM calculators are accurate enough for their real job, setting training percentages, when you use them correctly. The limits are genuine and worth carrying with you: the deadlift underestimation, the rep-range dependency, and the assumption that your set ended at failure. This calculator runs all seven formulas at once and shows you the spread, which is more information than any single-formula tool gives you. Use the tight-spread number with confidence, and treat a wide spread as a prompt to re-test. Start with the One Rep Max Basics guide, convert between rep maxes with Rep Max Equivalency, or go deeper on the math in All 1RM Formulas Compared.