
O’Conner Formula: Complete Guide
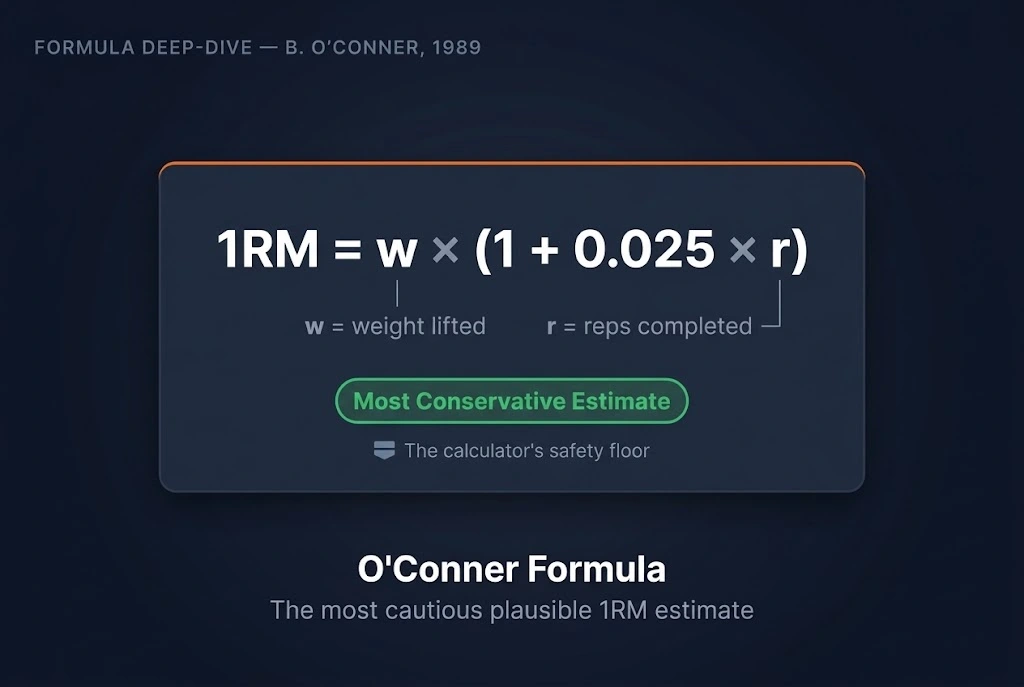
Run the calculator’s seven formulas on the same set, and from about 5 reps onward, O’Conner is typically the lowest number on the list. That’s the point, not a flaw: it’s the only formula built specifically to produce the most conservative plausible 1RM, adding 2.5% per rep instead of Epley’s 3.33%. This guide covers the notation, worked examples, the exact O’Conner-Epley relationship, and when a conservative floor is the right call.
At a Glance
- Formula: 1RM = w × (1 + 0.025 × r), equivalently 1RM = w × (40 + r) ÷ 40
- Type: Linear additive, same structure as Epley, but grows 25% more slowly per rep
- Per-rep growth: 2.5% per rep, versus Epley’s 3.33% and Brzycki’s variable rate
- Gap from Epley: Always exactly w × r ÷ 120 kg below Epley, predictable and constant
- Lowest formula at: r=5 (tied with Brzycki) through r=11 (sole lowest)
- No breakdown point: Valid at any rep count, no runaway overestimate like Lander or Brzycki
- Best use case: Conservative programming floor; new blocks; returns from injury
- Developed by: B. O’Conner (1989)
What Is the O’Conner Formula?
The O’Conner formula multiplies the lifted weight by a growth factor of 1 plus 0.025 times the rep count, adding exactly 2.5% for each rep performed. It shares a linear additive structure with Epley but uses a smaller growth factor (0.025 versus 1/30 ≈ 0.033), making it consistently more conservative. Among the seven formulas here, O’Conner produces the lowest estimates at 5-11 reps.
Notation and Plain English
Formula notation:
1RM = w × (1 + 0.025 × r)
Equivalent forms:
1RM = w × (40 + r) ÷ 40 (fraction form) 1RM = w + (w × r ÷ 40) (additive form)
In plain English: multiply your weight by 0.025, multiply that by your rep count, then add the original weight.
Step by step:
- Multiply your rep count (r) by 0.025
- Add 1 to get your growth factor (5 reps gives a factor of 1.125)
- Multiply by your weight (w)
- The result is your estimated 1RM
O’Conner quick reference, 100 kg input:
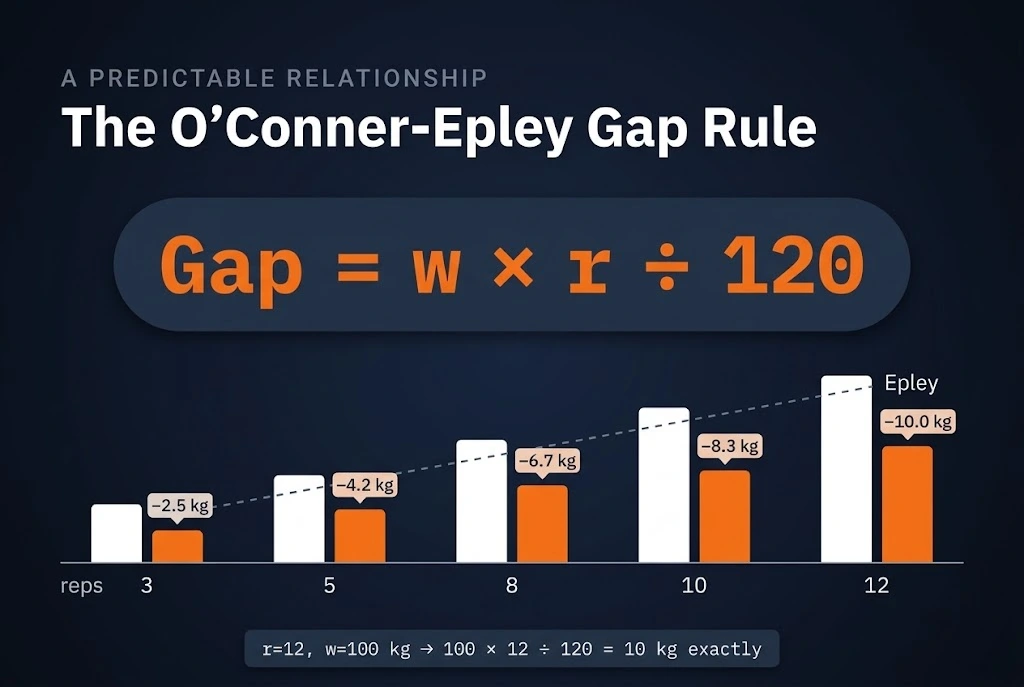
| Reps (r) | Growth Factor | O’Conner 1RM | Epley 1RM | Gap (O’Conner − Epley) |
| 3 | 1.075 | 107.5 kg | 110.0 kg | −2.5 kg |
| 5 | 1.125 | 112.5 kg | 116.7 kg | −4.2 kg |
| 8 | 1.200 | 120.0 kg | 126.7 kg | −6.7 kg |
| 10 | 1.250 | 125.0 kg | 133.3 kg | −8.3 kg |
| 12 | 1.300 | 130.0 kg | 140.0 kg | −10.0 kg |
| 15 | 1.375 | 137.5 kg | 150.0 kg | −12.5 kg |
The gap grows predictably with each rep. The rule: O’Conner is always w × r ÷ 120 kg below Epley.
The 0.025 Factor: Why O’Conner Is Always Below Epley
O’Conner’s factor of 0.025 is exactly 75% of Epley’s 1/30, so O’Conner adds 75 cents for every dollar Epley adds per rep. The gap between them isn’t random: it equals w × r × (1/30 − 1/40), which simplifies to w × r ÷ 120. At r=12 and w=100 kg: 100 × 12 ÷ 120 = exactly 10 kg. Check it: O’Conner gives 130 kg, Epley gives 140 kg, gap precisely 10 kg.
Who Developed the O’Conner Formula?
The O’Conner formula is attributed to B. O’Conner, published in 1989, in the same generation of strength research (1985-1993) that produced Epley, Lander, Lombardi, and Brzycki, an era when sports scientists were systematically building submaximal alternatives to dangerous maximum-effort testing. The deliberately conservative growth factor reflects an observation: many lifters complete more reps at a given percentage of 1RM than the more aggressive formulas predict. The 0.025 factor models a higher strength-endurance ratio, a design choice rather than an oversight. It’s sometimes spelled “O’Connor” in secondary sources; both refer to the same equation.
O’Conner Formula: Worked Examples
Example 1: Bench Press, 80 kg × 5 Reps
Calculation:
1RM = 80 × (1 + 0.025 × 5) = 80 × 1.125 = 90.0 kg
Comparison: Epley gives 93.3 kg. O’Conner runs 3.3 kg (3.5%) more conservative, real headroom for technique work or recovery from a layoff during the first few sessions of a new block.
Example 2: Squat, 100 kg × 8 Reps
Calculation:
1RM = 100 × (1 + 0.025 × 8) = 100 × 1.200 = 120.0 kg
Comparison: Epley gives 126.7 kg. O’Conner runs 6.7 kg (5.3%) more conservative, enough to change your working sets across a full block. The right call when there’s real uncertainty about whether the estimate reflects your current capacity.
O’Conner vs the Other 6 Formulas: The Full Comparison
O’Conner’s position in the seven-formula spectrum shifts with rep count: Brzycki is more conservative at 1-4 reps, O’Conner takes over from 5 through 11, then Lombardi overtakes it from 12 onward.
| Reps | O’Conner | Epley | Brzycki | Lander | Lombardi | Mayhew | Wathan |
| 3 | 107.5 kg | 110.0 kg | 105.9 kg | 107.2 kg | 111.6 kg | 114.0 kg | 109.0 kg |
| 5 | 112.5 kg | 116.7 kg | 112.5 kg | 113.7 kg | 117.5 kg | 119.0 kg | 116.6 kg |
| 8 | 120.0 kg | 126.7 kg | 124.1 kg | 125.1 kg | 123.1 kg | 126.3 kg | 127.7 kg |
| 10 | 125.0 kg | 133.3 kg | 133.3 kg | 134.1 kg | 125.9 kg | 130.9 kg | 134.7 kg |
| 12 | 130.0 kg | 140.0 kg | 144.0 kg | 144.4 kg | 128.2 kg | 135.4 kg | 141.5 kg |
| 15 | 137.5 kg | 150.0 kg | 163.6 kg | 163.3 kg | 131.1 kg | 141.7 kg | 150.9 kg |
| 20 | 150.0 kg | 166.7 kg | 211.8 kg | 208.9 kg | 134.9 kg | 151.2 kg | 164.5 kg |
Bold marks the lowest output at that rep count. O’Conner is lowest at 5 reps (tied with Brzycki) and holds the sole lowest from 6 to 11 reps. Lombardi takes over from 12 reps onward.
The r=5 Tie with Brzycki: An Exact Coincidence
At exactly 5 reps, O’Conner and Brzycki produce identical results: both give 112.5 kg from a 100 kg input. Below 5 reps, Brzycki is more conservative; above it, O’Conner is. The crossover is mathematically exact, not an approximation, so for a 5-rep set, O’Conner and Brzycki are interchangeable. The choice only matters at other rep counts.
Why O’Conner Stays Reasonable at High Rep Counts
At 15-20 reps, the table shows something worth noticing. Brzycki (163.6-211.8 kg) and Lander (163.3-208.9 kg) produce wildly inflated estimates, while O’Conner (137.5-150.0 kg) stays plausible. O’Conner’s 2.5% per-rep growth is bounded by simple arithmetic; the denominator never approaches zero the way it does in the linear-denominator formulas. At 20 reps, O’Conner gives 150 kg against Brzycki’s 211.8 kg, a 41% difference. O’Conner is the least unreliable formula at high reps, though any estimate that high should be treated as a rough approximation only.
How Accurate Is the O’Conner Formula?
O’Conner was included in the LeSuer et al. (1997) validation study, tested across all three competition lifts. Like all seven formulas, it showed a correlation greater than 0.95 with actual 1RM but produced the smallest predictions at most rep ranges. Being conservative doesn’t mean being inaccurate.
“Conservative” vs “Wrong”: An Important Distinction
O’Conner’s lower predictions assume a higher strength-endurance ratio: that the lifter completes more reps at any given percentage of 1RM than other formulas assume. For lifters whose rep-max curve is shallower than average, slow-twitch dominant, or highly conditioned endurance athletes, O’Conner may be the most accurate formula available. For fast-twitch dominant athletes who hit failure earlier at any percentage of 1RM, it will underestimate. Neither scenario makes it wrong; it makes it right for the population it fits.
Accuracy by scenario:
- Strength-endurance athletes (cyclists, rowers, and distance runners who lift): O’Conner likely lands closest to true 1RM, since their rep-max curves are shallower
- Intermediate strength athletes with consistent training: O’Conner produces a reliable conservative floor, typically 5-8% below true 1RM
- Fast-twitch dominant or powerlifting-focused athletes: O’Conner will underestimate; Epley or Wathan is likely more accurate
- Beginners at 8-10 reps: O’Conner’s conservative output is intentionally useful, preventing overloaded early programming
For the broader validation research across all 7 formulas and how O’Conner’s accuracy compares in context, see How Accurate Are 1RM Calculators?
When to Choose the O’Conner Formula
O’Conner’s conservatism is a feature, not a limitation, in the right context.
- Starting a new block with an untested 1RM. Lighter working sets than Epley would prescribe, giving room to adapt before the load climbs.
- Returning from injury or extended detraining. Strength loss during time off is real; the lowest plausible estimate is the most responsible anchor for a return phase.
- Working with beginners. Aligns with standard novice guidance: start conservative, build progressively. See 1RM for Beginners.
- High-rep estimation sets (8-12 reps). The most stable formula is right where every formula becomes less reliable.
- Checking the spread between formulas. When the output shows a wide spread, O’Conner gives you the floor, and the gap to Epley shows how sensitive the estimate is to your rep count.
Limitations of the O’Conner Formula
- Underestimates fast-twitch dominant athletes. Powerlifters, weightlifters, and sprint athletes concentrate strength at low rep counts; their rep-max curves run steeper than O’Conner assumes.
- Not the best sole programming anchor. Using it alone for a full cycle risks perpetually underloaded working sets. Best used as the floor within the seven-formula output, not the definitive number.
- Less conservative than Brzycki below 5 reps. For maximum conservatism at very low reps, Brzycki or Lombardi is the better pick.
- Deadlift underestimation compounds. Already the lowest general estimate, its deadlift output runs the most conservative of the group and may set training loads too light. Add 5-10% to any deadlift output regardless of formula.
How to Use the O’Conner Formula with the Calculator
The one rep max calculator runs O’Conner alongside all six other formulas at once. Its row is most useful as the floor anchor: a consistently low output relative to the rest signals your input set ran moderate-to-high (8+ reps), and your true 1RM likely sits between O’Conner and Epley.
Reading your O’Conner output:
- O’Conner and Epley within 3 kg of each other: your input set was low-rep (1-4 reps); all formulas are reliable here, use any formula’s average.
- O’Conner 5-8 kg below Epley: your input set ran 6-9 reps; use O’Conner for a conservative programming floor and Epley for a standard estimate.
- O’Conner 10+ kg below Epley: your input set was 12+ reps; treat all estimates with real uncertainty and re-test with a heavier weight for fewer reps before programming.
Use the Percentage & Rep-Max Table to convert any O’Conner estimate into a full training load chart, and cross-check the result against the NSCA’s published training load chart if you want a second reference point.
Frequently Asked Questions
The 0.025 per-rep growth rate makes O’Conner the most conservative formula at moderate rep counts and the most stable of the seven at high ones. Choosing it isn’t choosing the wrong formula; it’s choosing the most cautious plausible estimate from seven valid options, with the w × r ÷ 120 gap to Epley always predictable and visible. Start with 1RM Formulas & Calculations, compare it directly against Epley Formula: Complete Guide, or see the full field in All 1RM Formulas Compared.